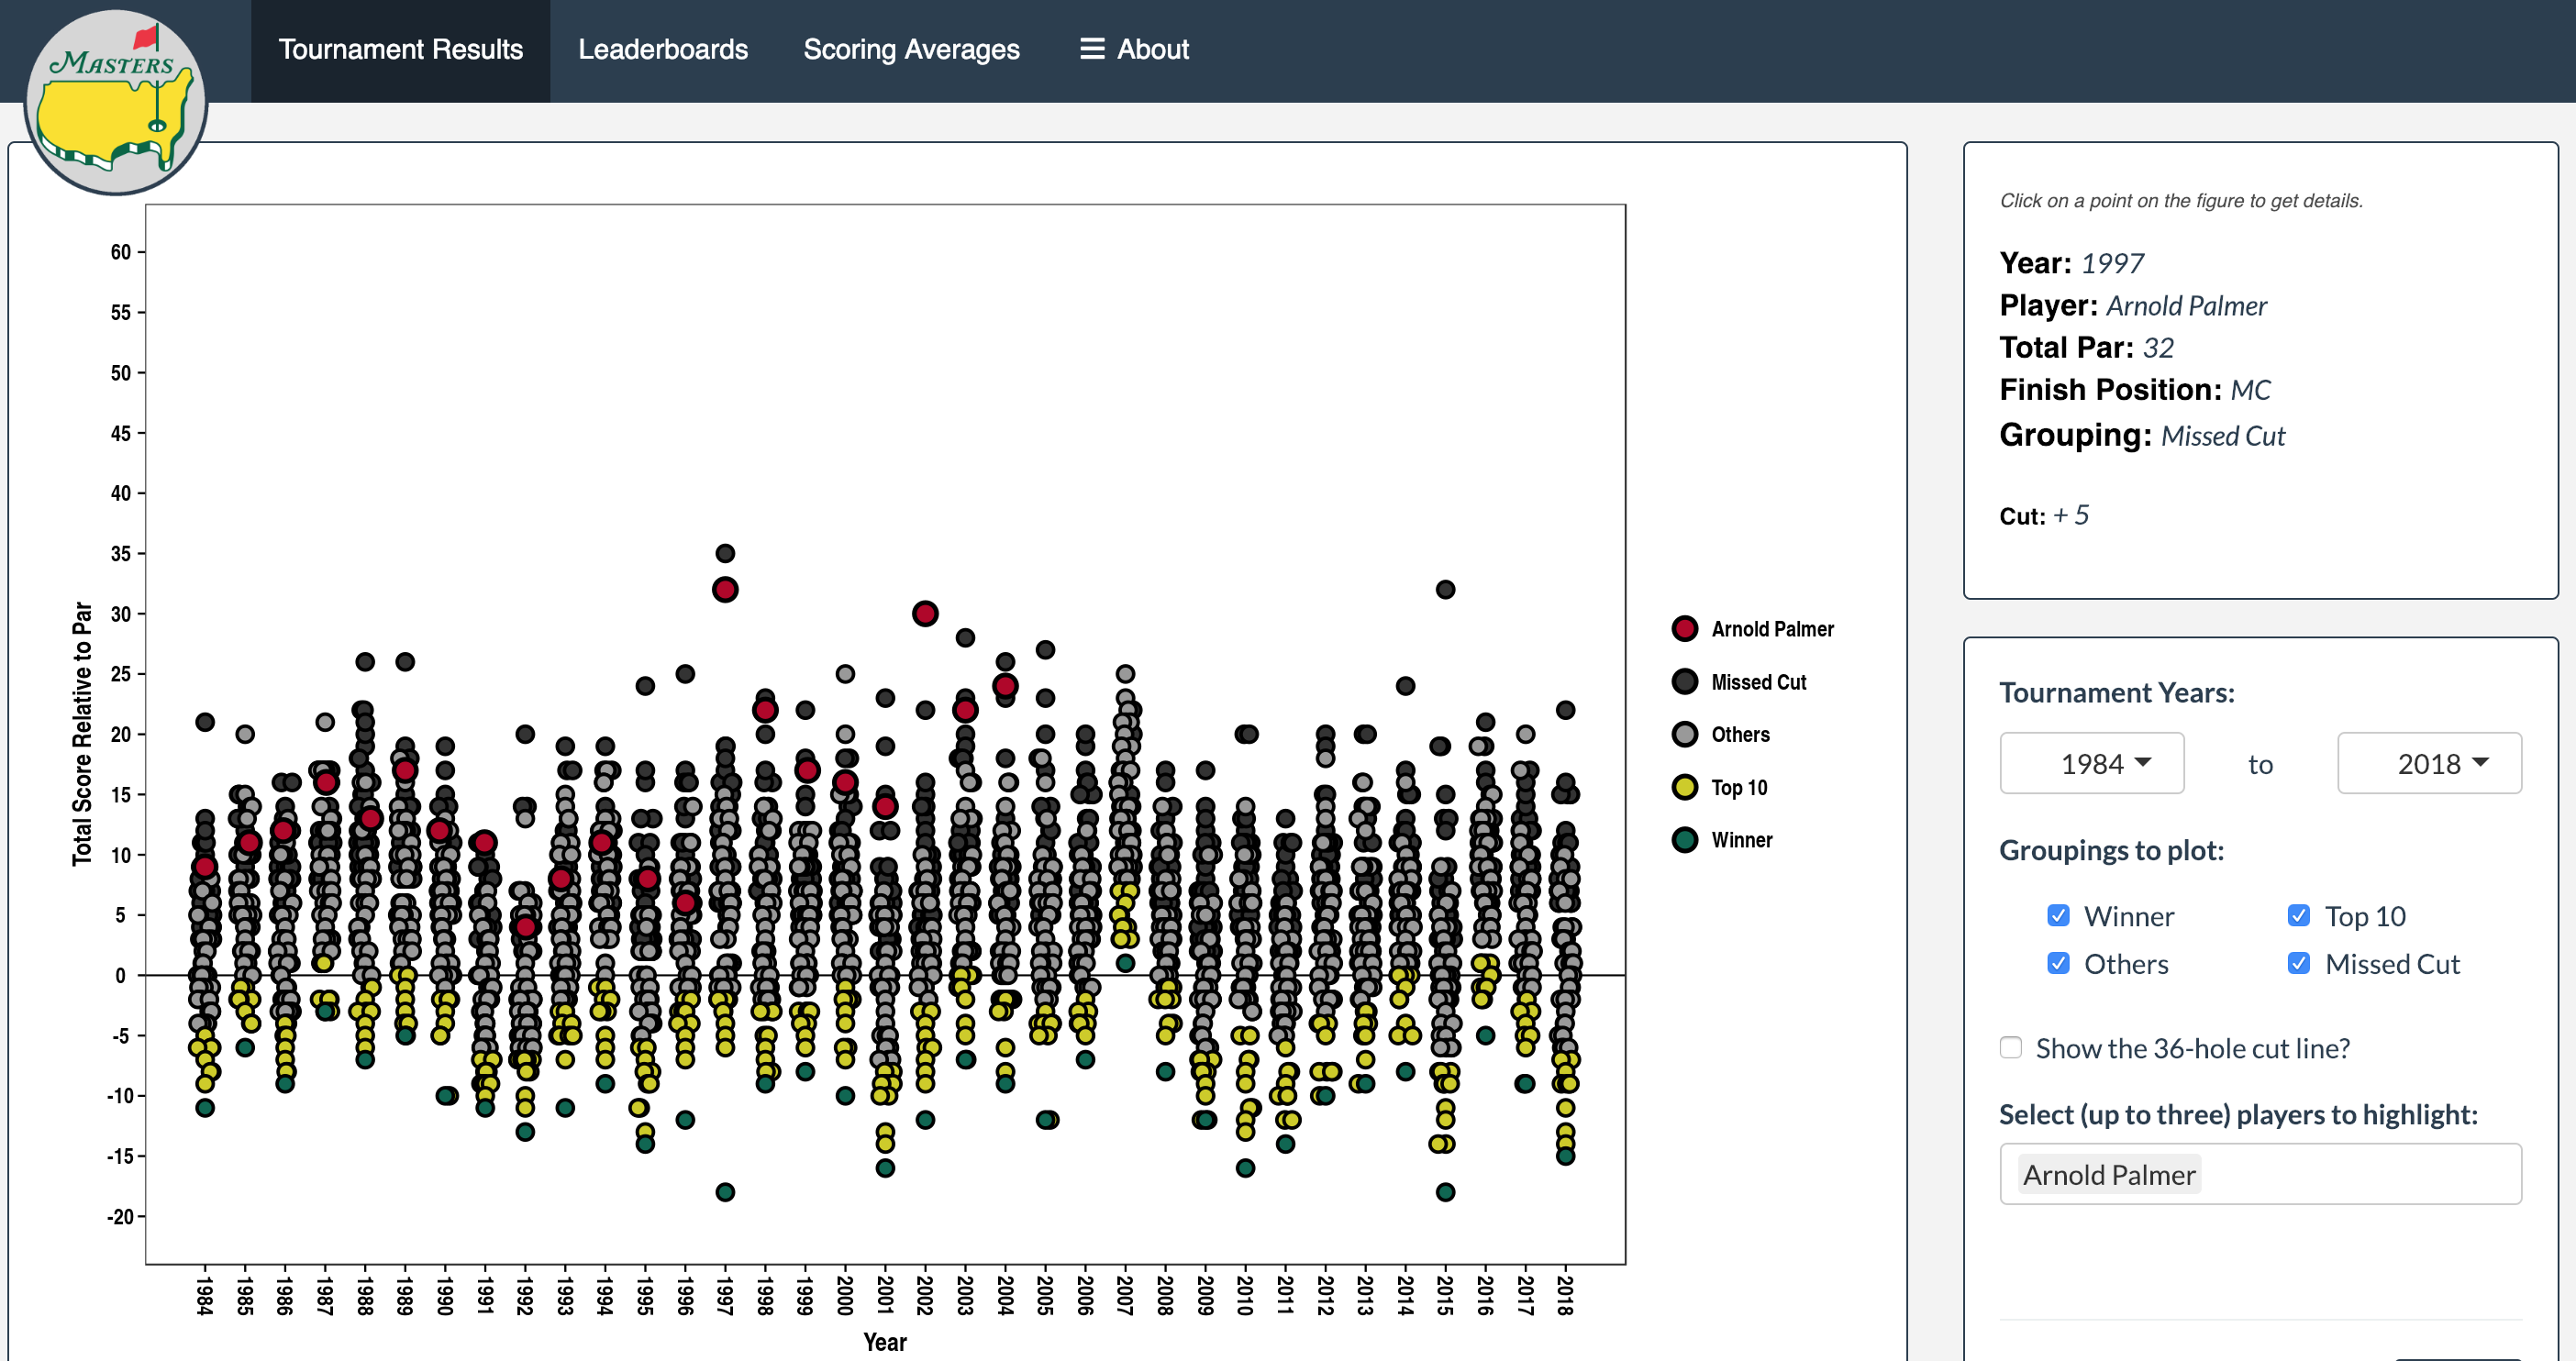
| The Masters offers users a tool to explore and visualize the history of The Masters golf tournament. Among other things, you can see whether scores have changed over time, play with aggregated historical leaderboards, and review players' scoring averages. This is included on RStudio's Shiny User Showcase. | |
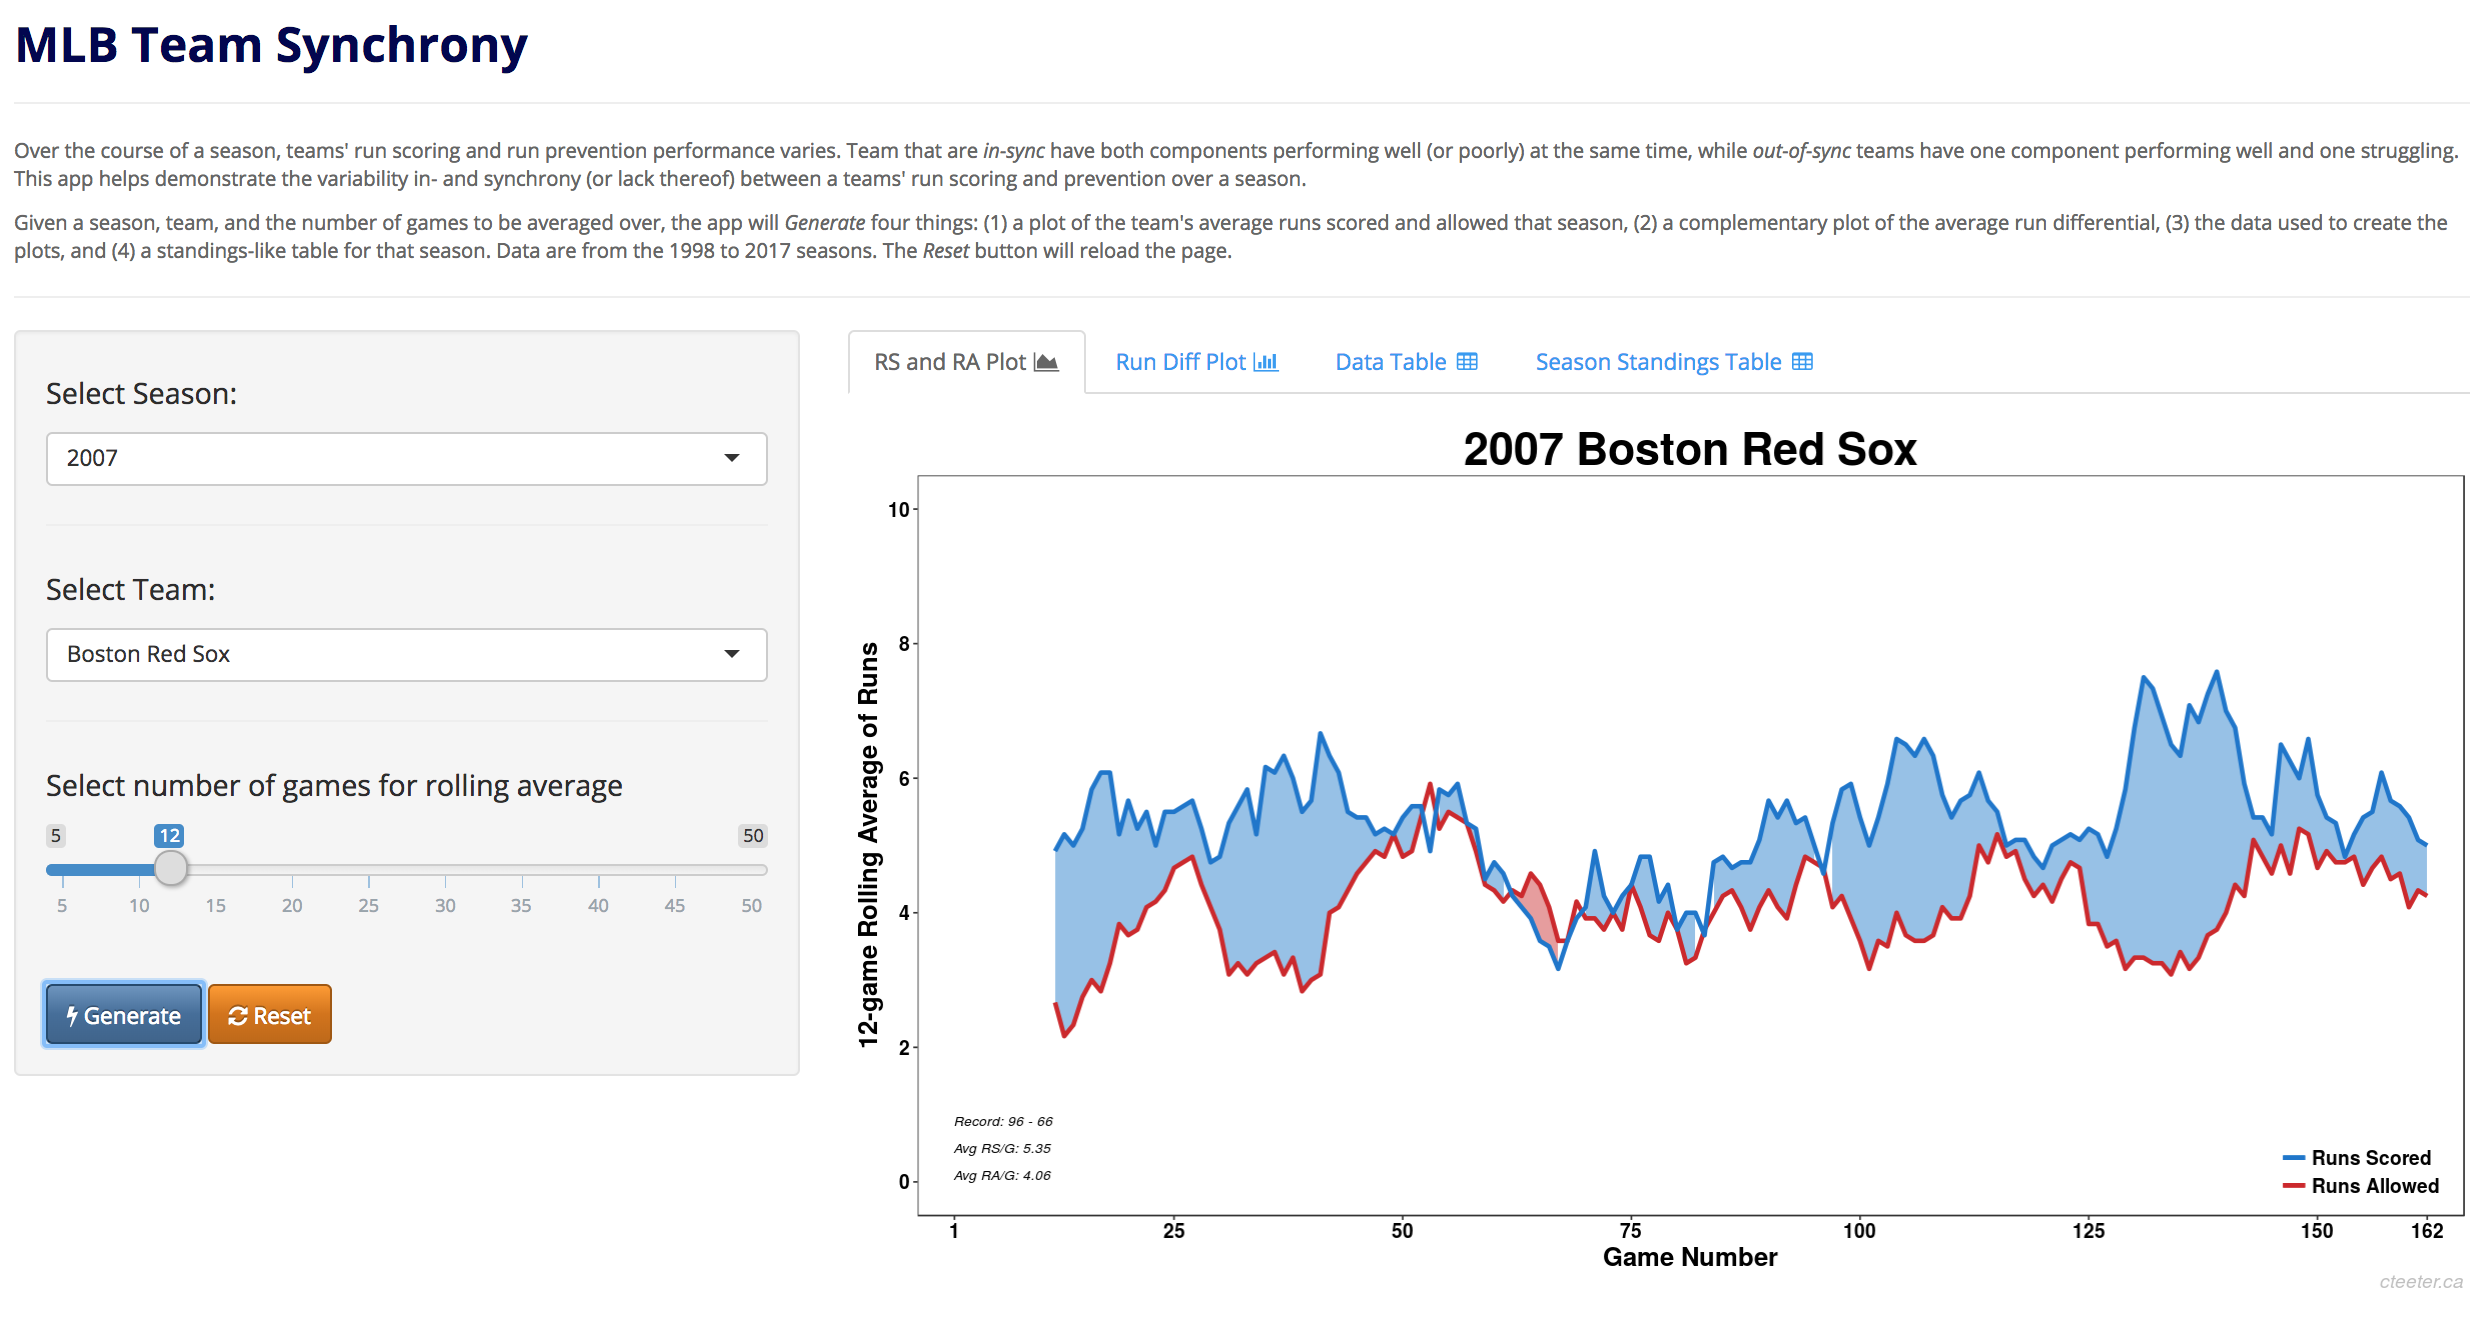
| MLB Team Synchrony uses major league baseball data from 1998-present to allow users to examine how run scoring and run prevention vary over the course of a season, and how these can be in-sync, leading to periods of consistent results (wins or losses), or out-of-sync, leading to a one-step-forward-one-step-back feeling. | |
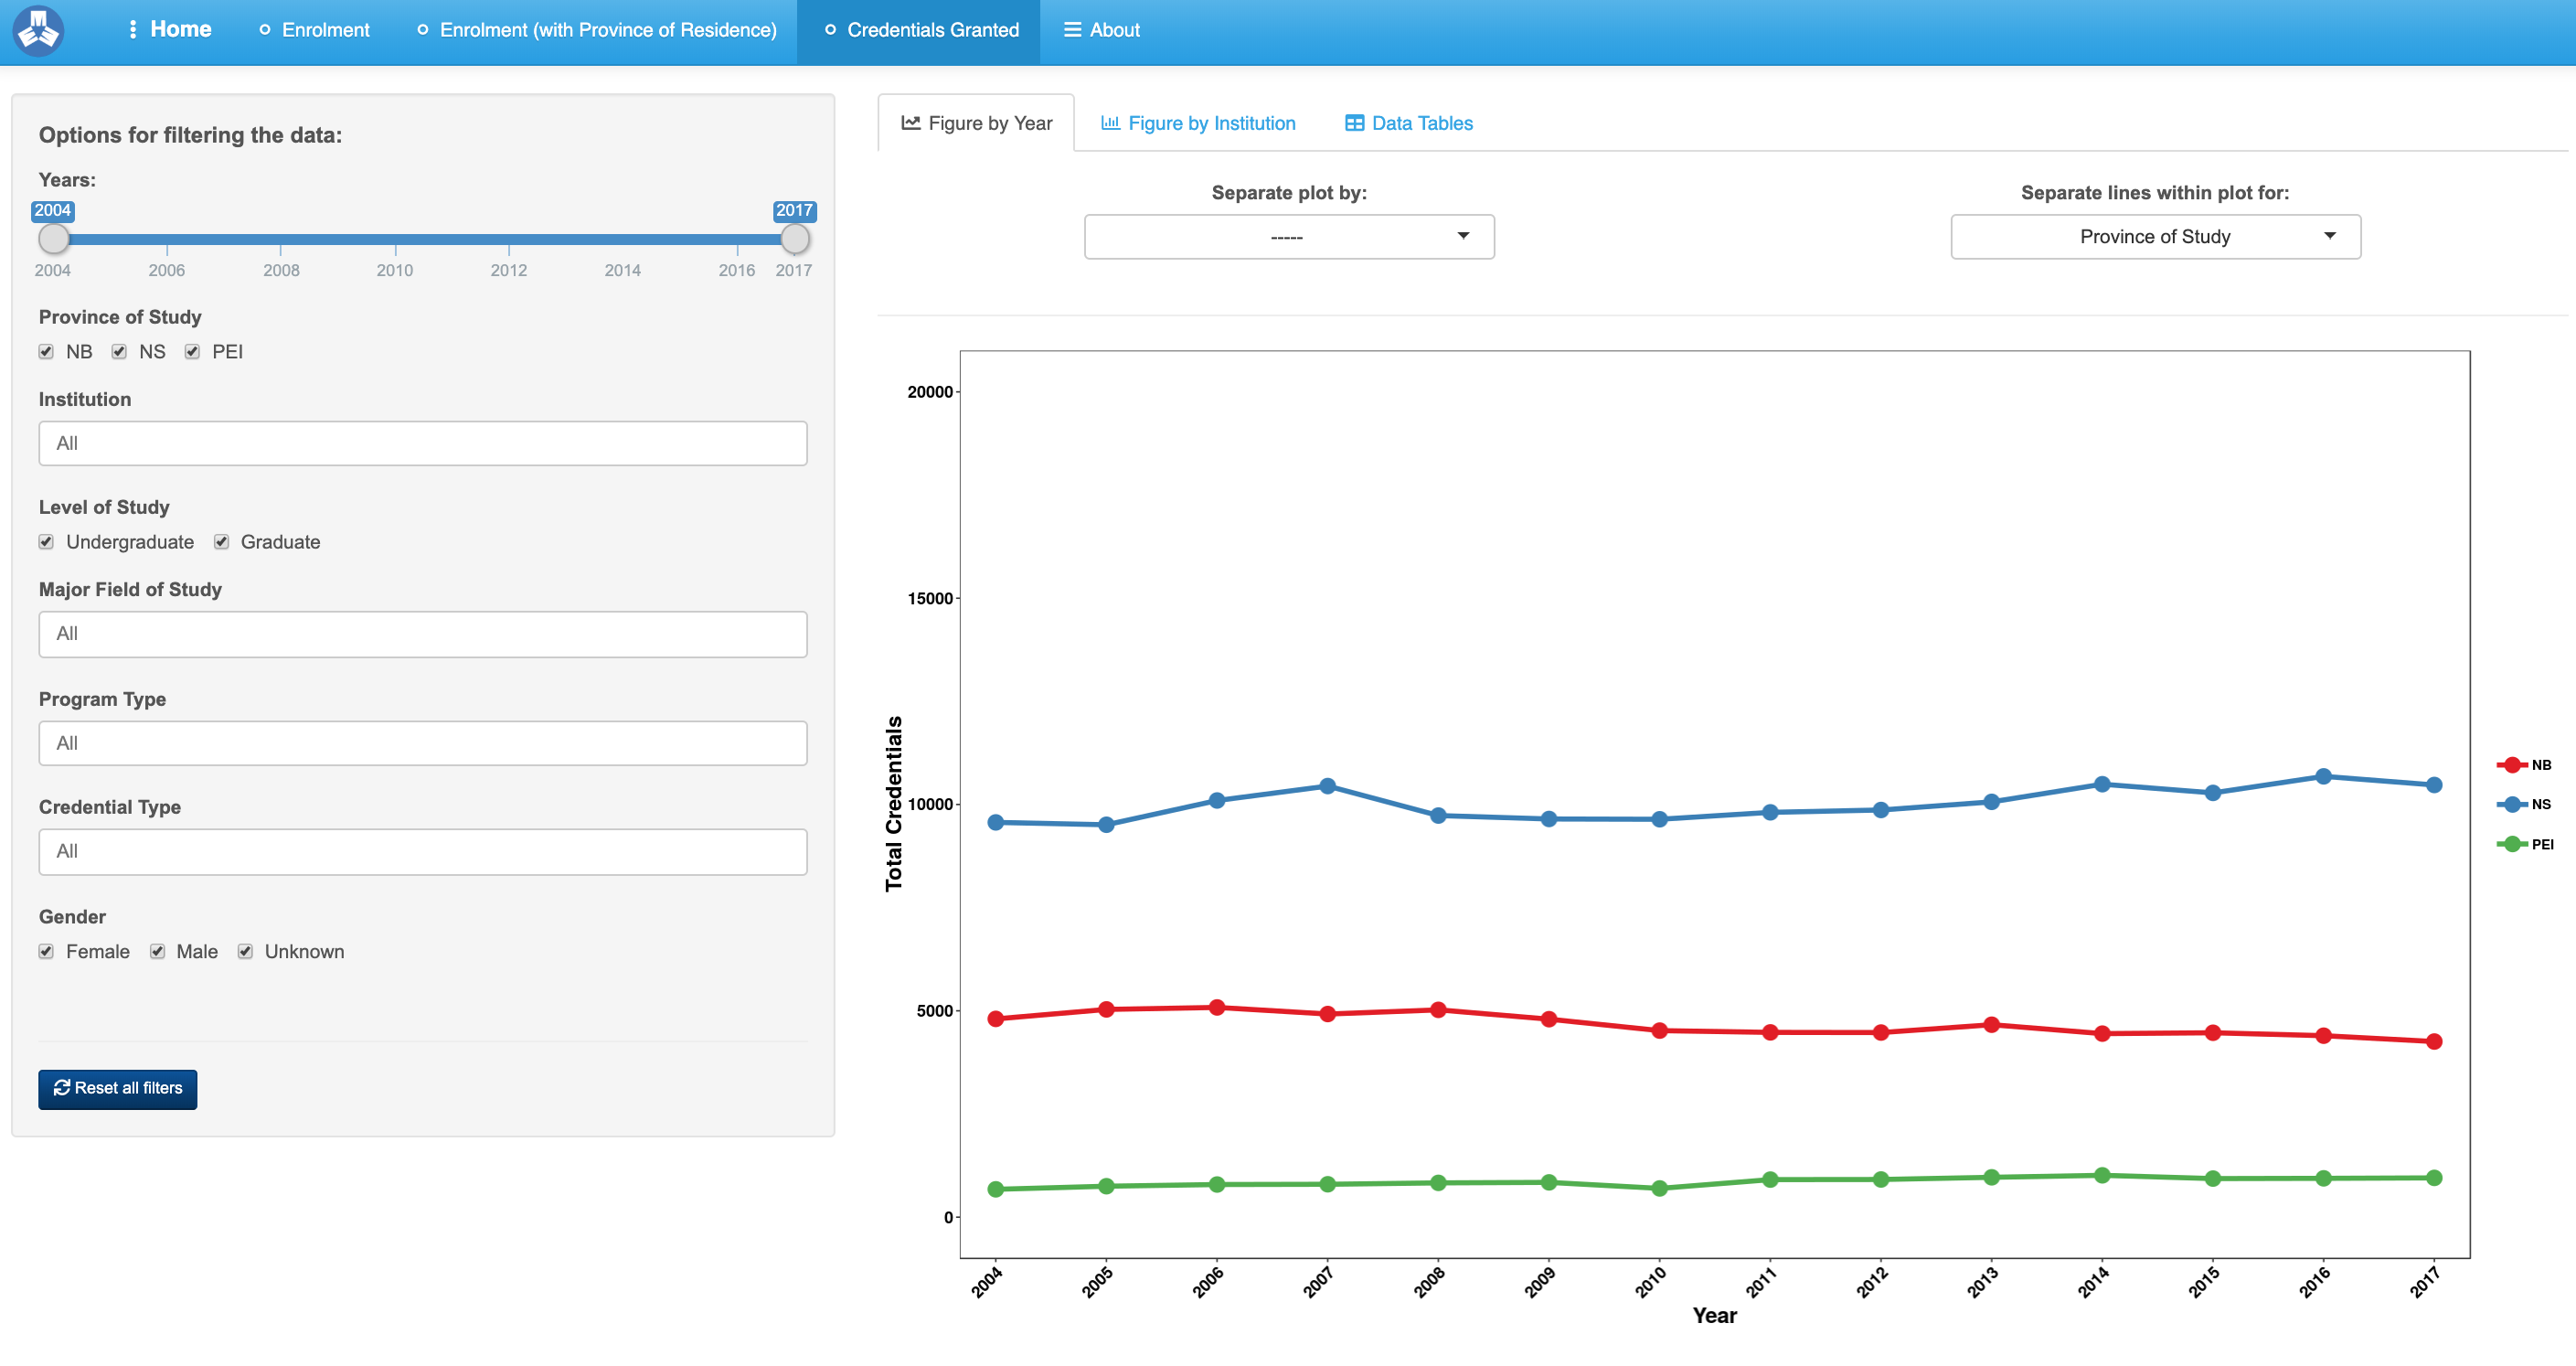
| MPHEC Interactive Graphs: Enrolment and Credentials Granted is an application I built for my previous employer, the Maritime Provinces Higher Education Commission (MPHEC). It allows users to explore enrolment and credentials granted data from the universities in the three Maritime provinces. The application is also available in French. | |
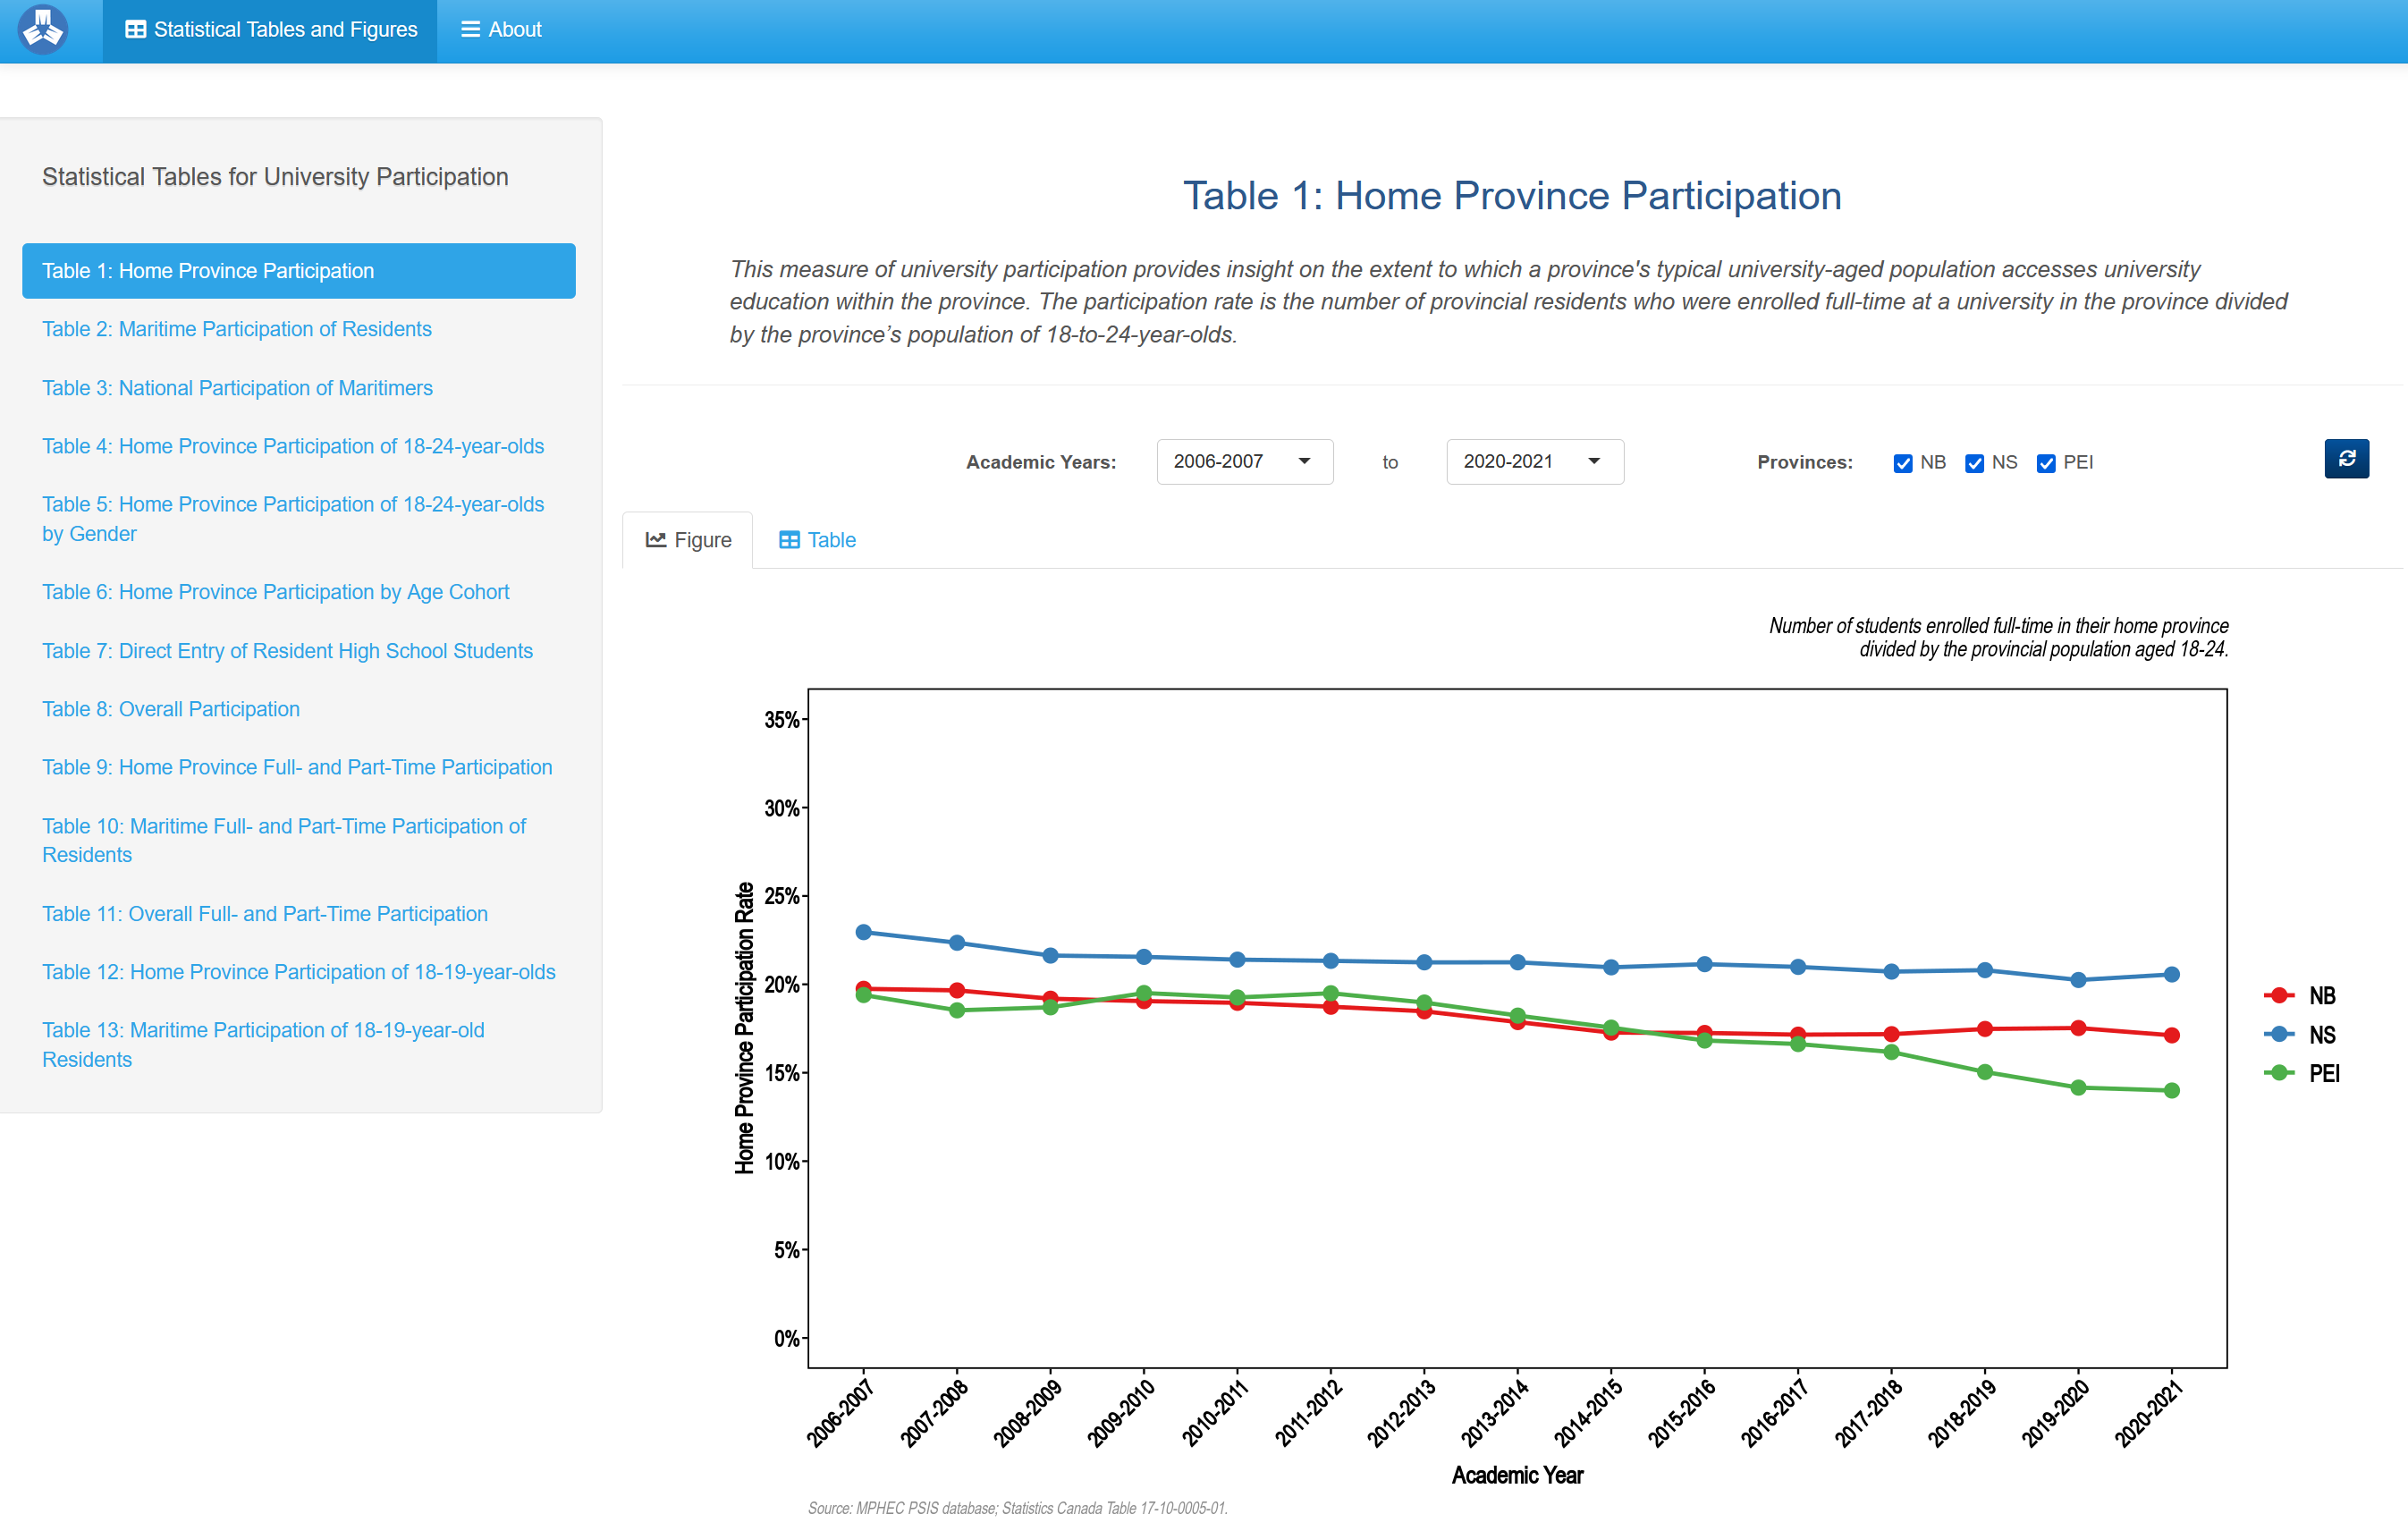
| MPHEC Interactive Graphs: University Participation is another application I developed for the MPHEC. It allows users to explore data related to university participation rates within the three Maritime provinces. It is also available in French. | |
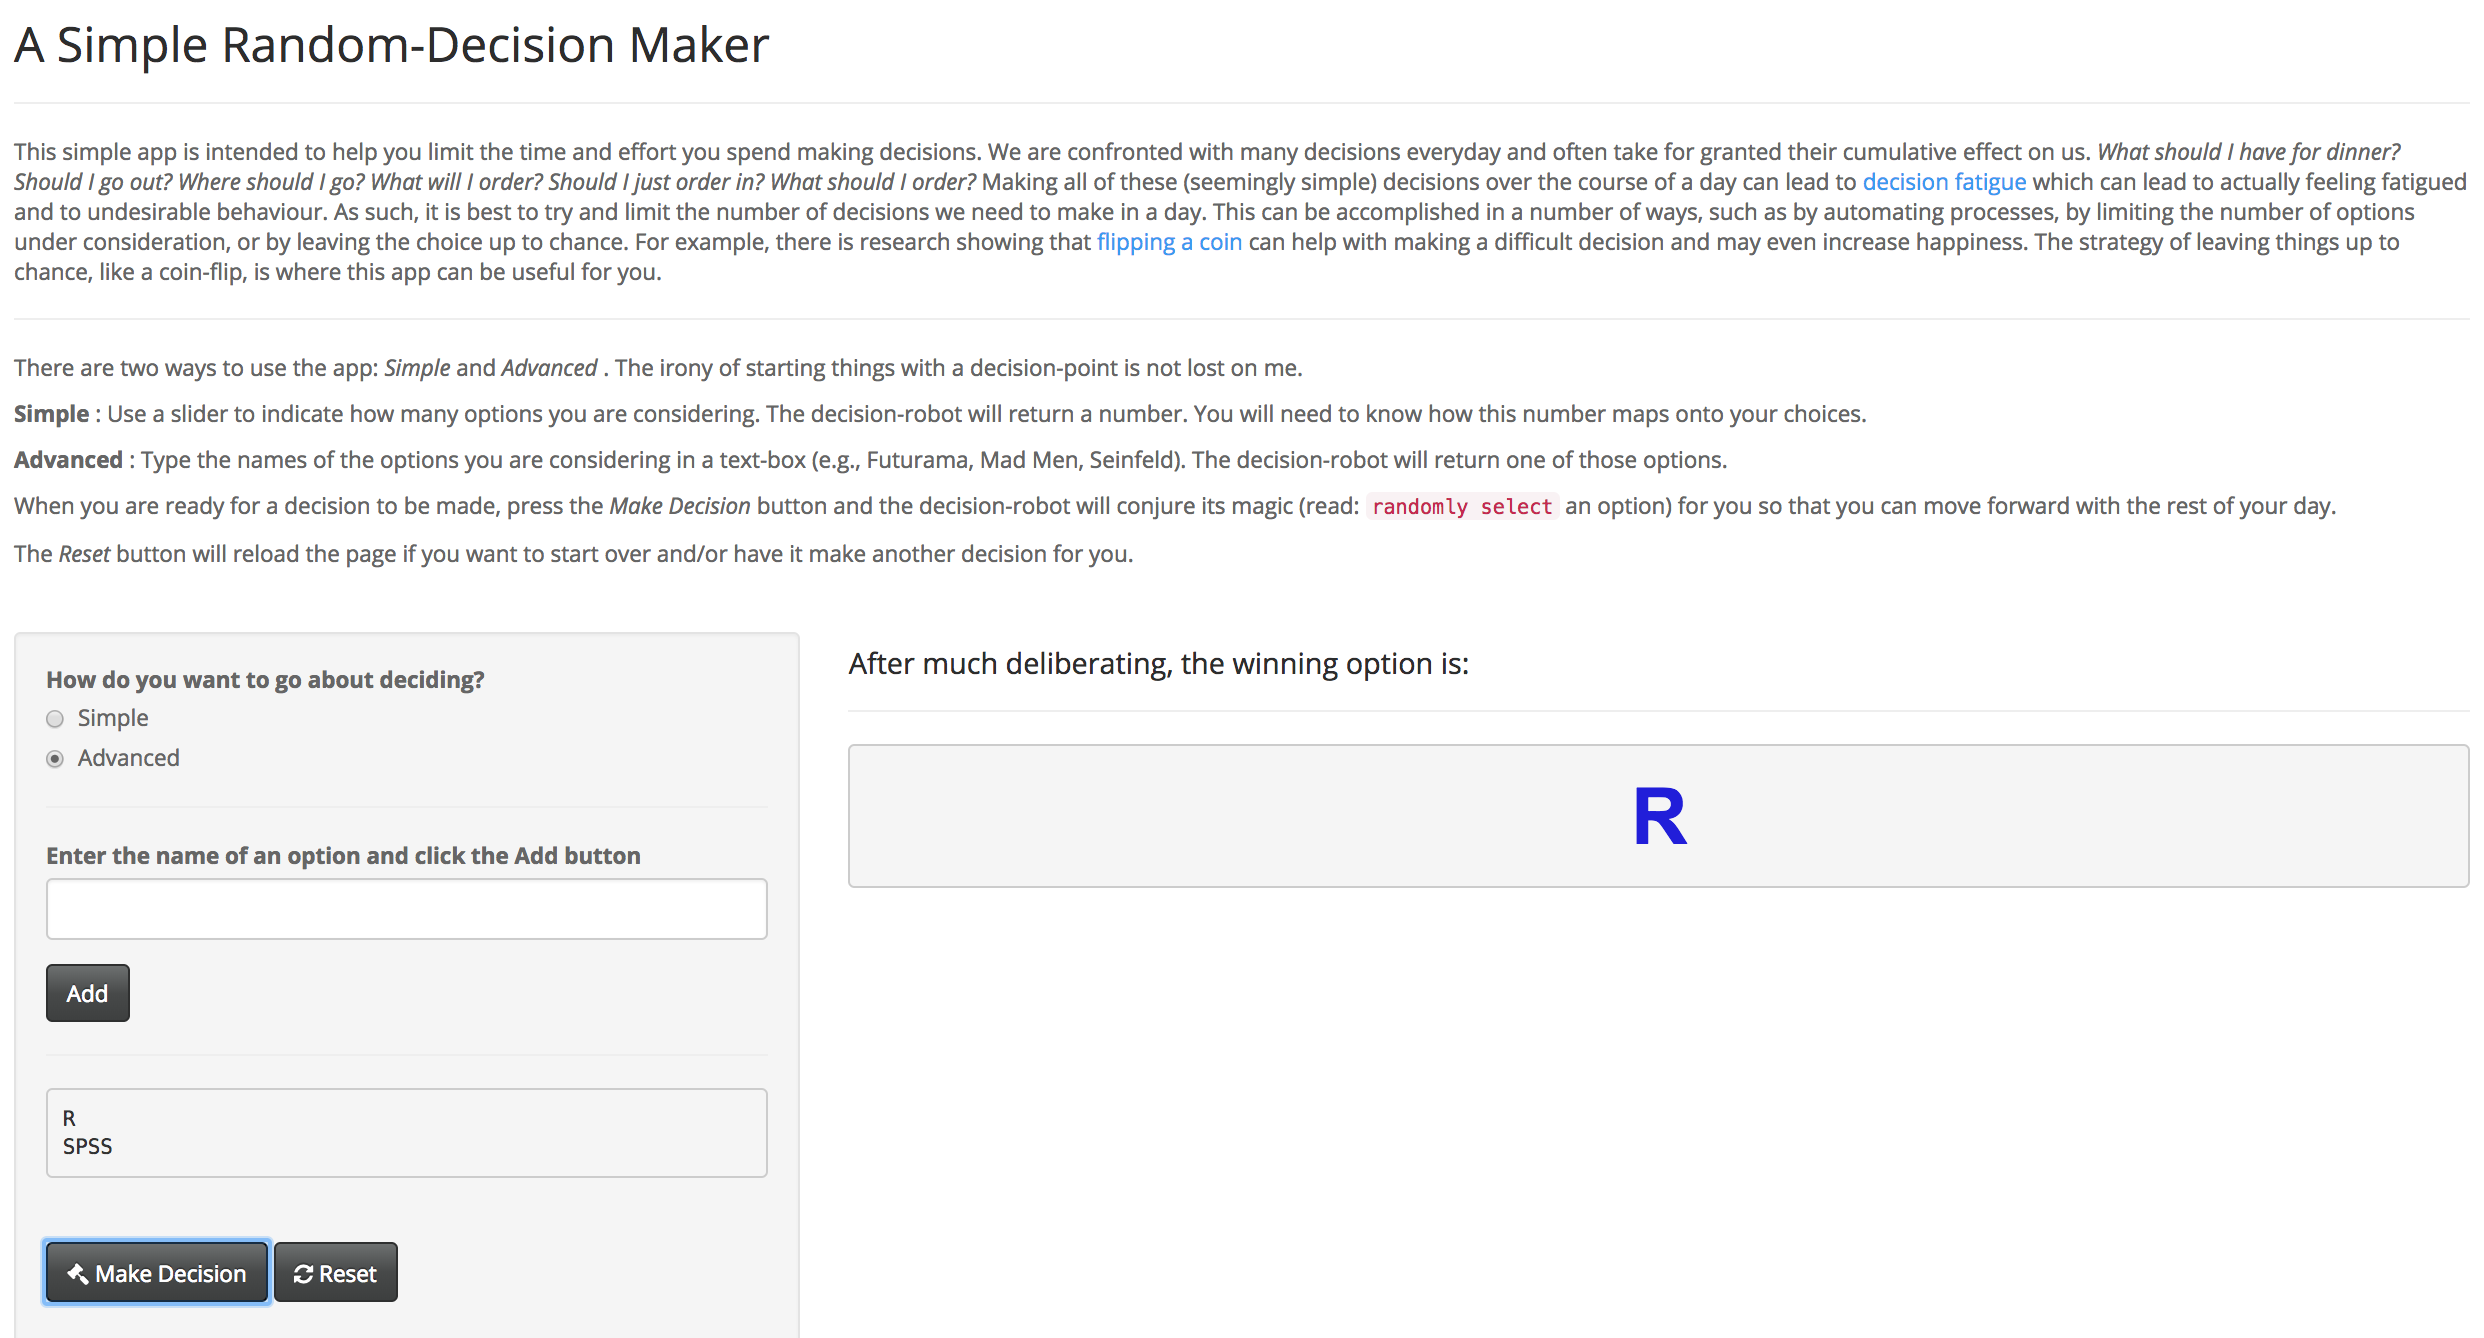
| Decision Maker takes input on options for a decision you are trying to make and returns a randomly selected choice. It is intended for people like me who perpetually overthink simple things. |
Please contact me if an application is not working and/or you have suggestions for improvement.
