The Monty Hall Problem is a counter-intuitive statistical puzzle stemming from one of the situations presented to contestants on Let’s Make a Deal. I was first exposed to the problem in an introductory Bayesian statistics course. Many months ago, I wrote code to simulate the problem and intended on using it as a teaching tool, but an opportunity to do so never materialized so it has sat idle on my hard drive ever since. I am not the first person to simulate this problem, but rather than leave it hidden away on my computer I figured I would revisit and work through it here.
The Problem
The problem is fairly simple: you are on a game show and given the chance to choose one of three doors. Behind one of the doors is a prize (typically a car) and behind the other two doors is something not considered a prize (typically goats). You pick one of the doors, say Door #1, and then the host (Monty Hall), who has insider information as to what is behind each door, goes and opens one of the two doors you did not pick, say Door #2, which has a goat. The host will always open a door that has a goat behind it. You are then offered the choice of staying with your original pick (Door #1) or switching to the other unopened door (Door #3).
Should you stay or switch?
The Simulation
I have written the code to simulate the problem n times over s seasons and produce a summary output table and plot of the results. The incorporation of the seasons element is unnecessary but simulates the idea of the problem happening within the context of a television show and, more interesting for me, allows for the calculation of error around the point estimates. To simplify things I will (mostly) work through the code ignoring this seasons component.
First, load the packages that help the code run:
require(tidyverse)
I use a function to simulate the problem. The function takes three values (i.e., strategy, iterations, and seasons) and produces outputs. The first section of the function creates an empty data frame to record results and initiates a loop to work through the seasons of iterations:
MontyHall <- function(switch = TRUE, n = 1000, seasons = 1) {

        # Setup data frame to record results
        outcome <- data.frame(Season = numeric(),
                              Strategy = character(),
                              Prize = character(),
                              Instances = numeric(),
                              Percent = numeric())

        # Allow for multiple 'seasons' of playing the game n times.
        for (s in 1:seasons) {
Within this seasons for loop I simulate the problem n times. The core of the simulation code is:
# Setup vector to record the prize results of each iteration of the game (1 = car, 0 = goat) --------
game_result <- NULL

	for (p in 1:n) {
		# Set up components of the game

		# 1. Randomly arrange the prizes behind the doors
		prizes <- c('Car', 'Goat1', 'Goat2')
		door_setup <- sample(prizes, 3)

		# 2. Contestant makes their initial choice
		contestant_choice <- sample(1:3, 1)

		# 3. Host opens a door with a goat behind it
		door_reveal <- ifelse(door_setup[contestant_choice] == 'Car',
					sample(door_setup[-c(contestant_choice)], 1),
					door_setup[-c(contestant_choice, which(door_setup == 'Car'))])

		# 4. Make a final door selection based on the strategy of the contestant and add the result of their decision to the game_results vector created above
		if (switch) {
			contestant_prize <- door_setup[-c(contestant_choice, which(door_setup == door_reveal))]
			game_result[p] <- ifelse(contestant_prize == 'Car', 1, 0)
		} else if (!switch) {
			contestant_prize <- door_setup[contestant_choice]
			game_result[p] <- ifelse(contestant_prize == 'Car', 1, 0)
		}
	}
Once n iterations have been completed, the game_result vector is used to fill out the outcome data frame.
tmp_outcome <- data.frame(Season = rep(s, 2),
				Strategy = ifelse(switch, rep('Switch', 2), rep('Stay', 2)),
				Prize = c('Car', 'Goat'),
				Instances = c(sum(game_result), sum(!game_result)),
				Percent = c(round(sum(game_result)/n, 4)*100,
						round(sum(!game_result)/n, 4)*100))

outcome <- rbind(outcome, tmp_outcome)
If the function was initiated with multiple seasons the process above is repeated for s seasons. The outcome data frame is used to produce a results table and plot of the results.
# Results summary table
outcome_summary <- outcome %>%
			group_by(Prize) %>%
			summarise(Mean = round(mean(Percent, na.rm = T), 4),
					StDev = round(sd(Percent, na.rm = T), 4),
					CI = round((qnorm(0.975)*StDev)/sqrt(seasons), 4))

# Plot Results
outcome_plot <- ggplot(outcome_summary, aes(x = Prize, y = Mean)) +
			{ if (seasons > 1) geom_errorbar(aes(ymin = (Mean - CI), ymax = (Mean + CI)), color = 'black', size =  1, width = 0) } +
			geom_point(size = 4, stroke = 1.75, pch = 21, color = 'firebrick3', fill = 'white') +
			scale_y_continuous(breaks = seq(0, 100, 10), limits = c(0, 100)) +
			labs(x = "Contestant's Prize",
				y = if(seasons > 1) { 'Relative Frequency [+/- 95% CI]' } else { 'Relative Frequency' },
				title = paste0("Results from ", {if(seasons > 1) { paste0(seasons, " runs of ") }}, n, " iterations of the Monty Hall Problem \n in which the contestant always", ifelse(switch, " SWITCHES from their initial choice.", " STAYS with their initial choice."))) +
			theme_teeter() # this is a custom ggplot theme based on theme_bw()
Finally, the function returns three things: (1) the outcome data frame, (2) the outcome summary data frame used to make the plot, and (3) the plot.
return(list("data" = outcome, "summary" = outcome_summary, "plot" = outcome_plot))
The Results
So, should you stay or switch? We can simulate a single season of 125 iterations of the game in which the contestant always stays with their original choice and then get a plot of the results.
MontyHall(switch = F, n = 125, seasons = 1)$plot
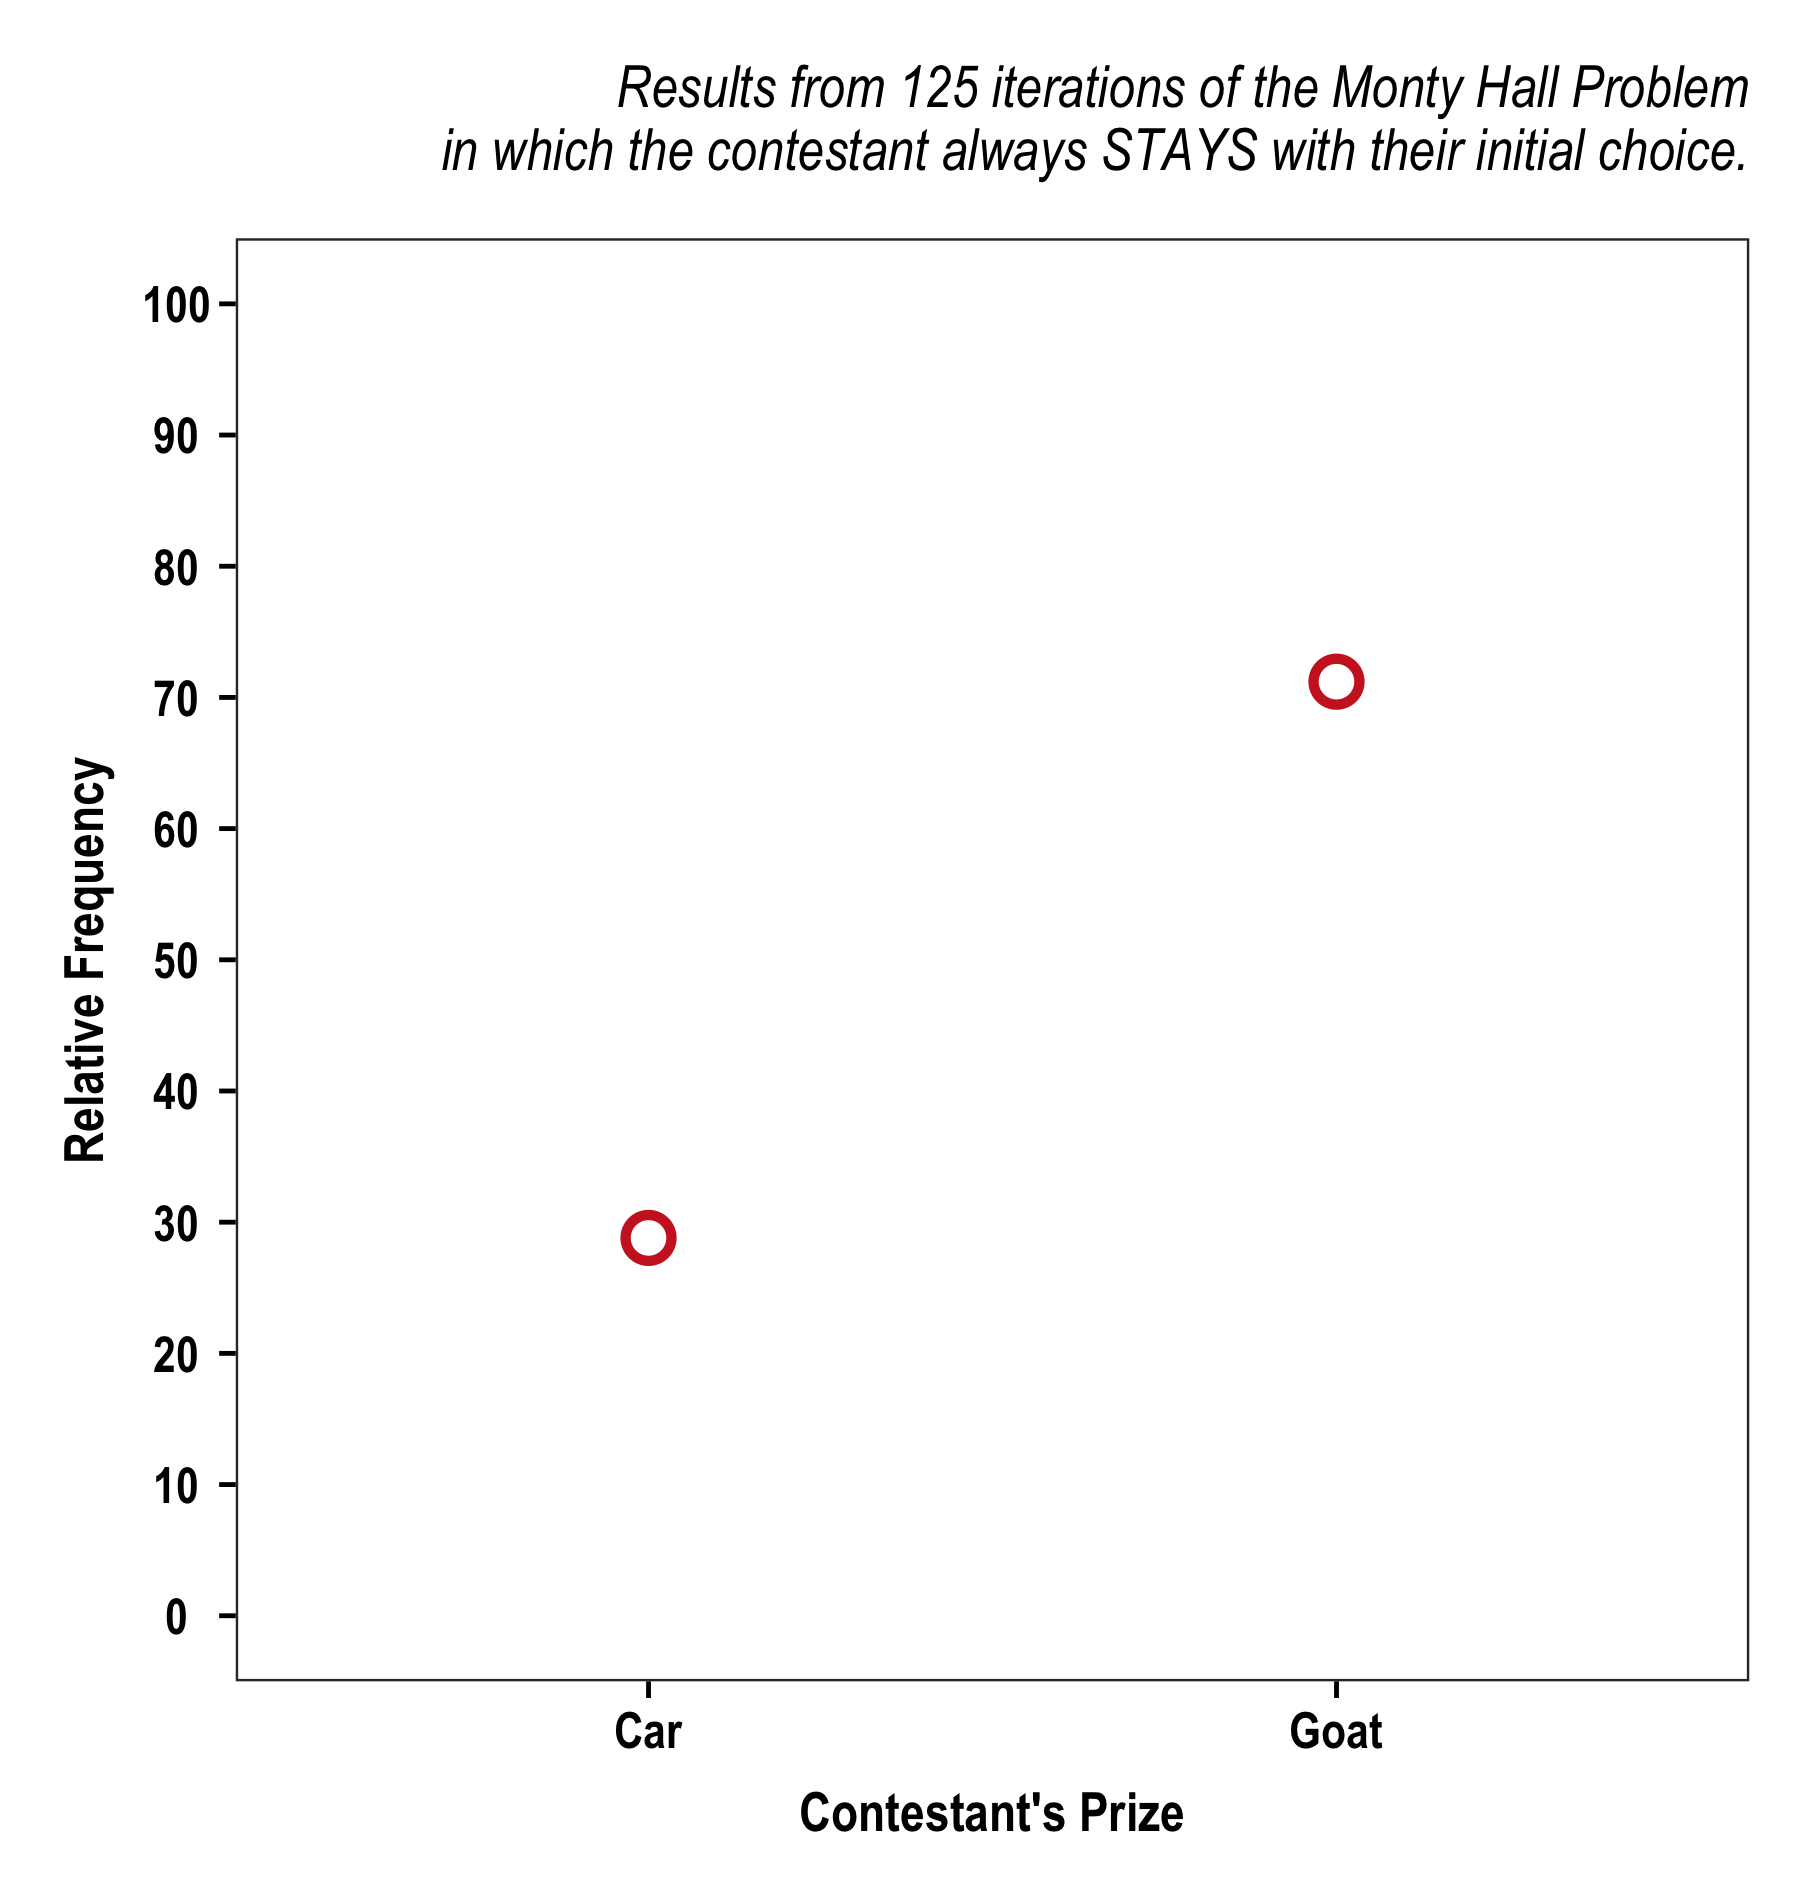
Looks like staying leads to goats. But that was only one season. Maybe it was bad luck. Let’s run it for 10 seasons.
MontyHall(switch = F, n = 125, seasons = 10)$plot
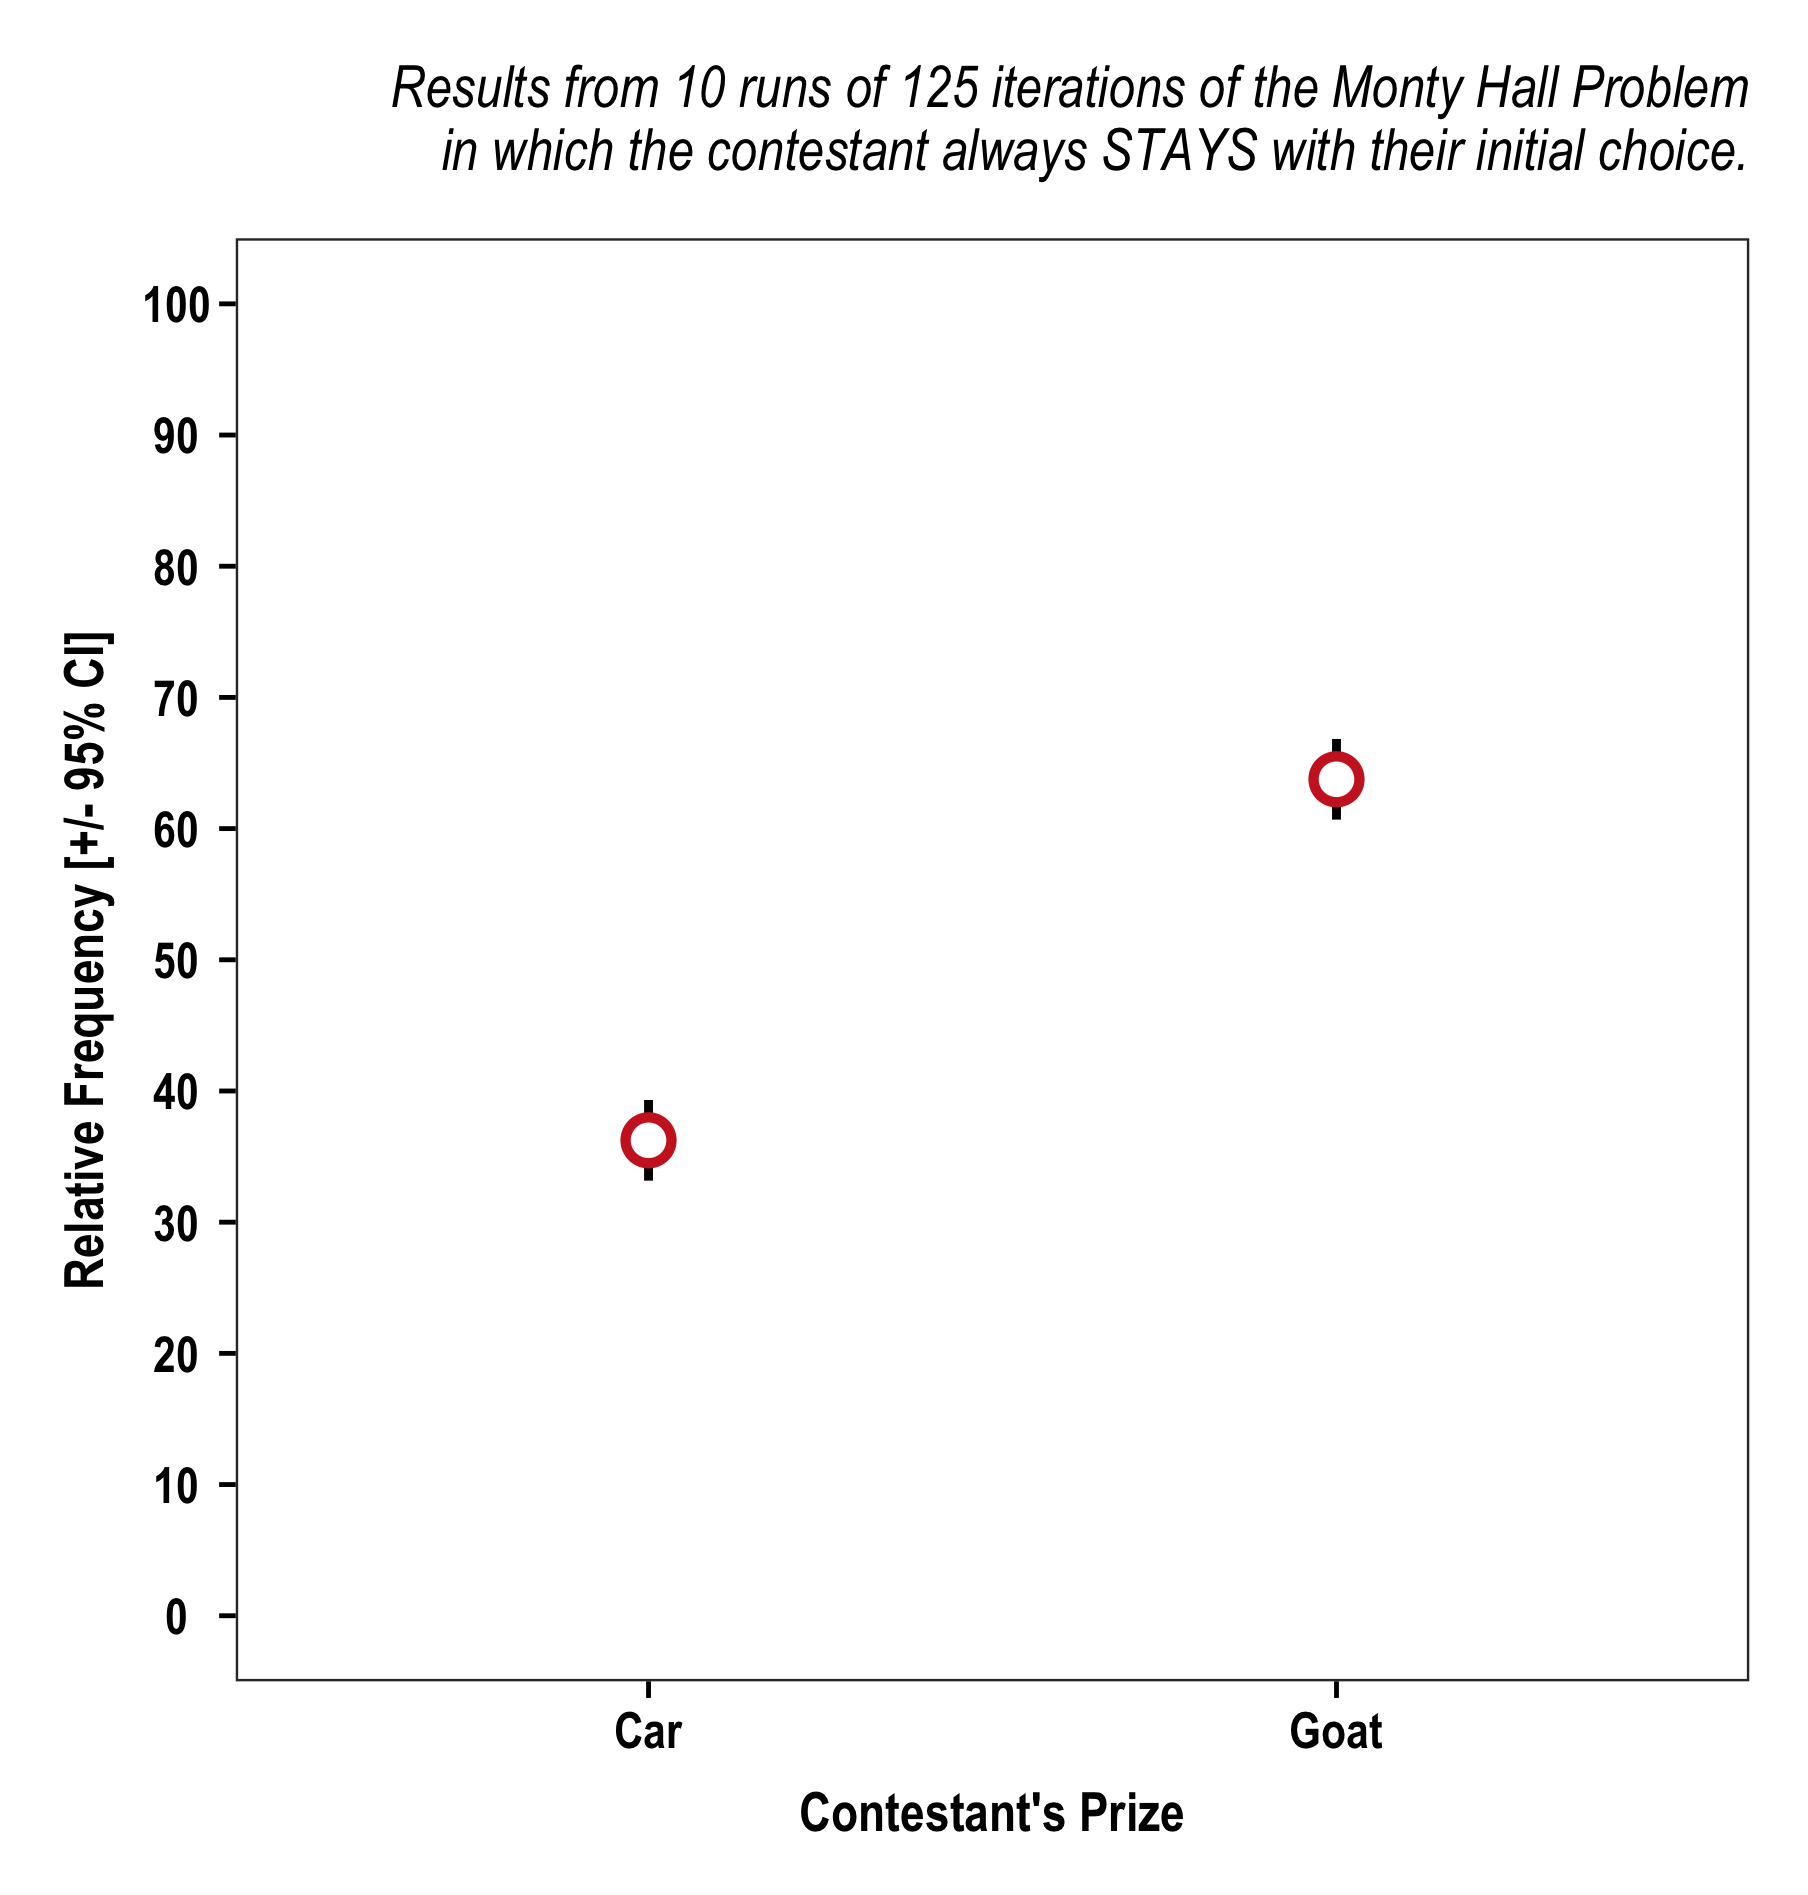
Staying leads to goats.
Switching is the much better strategy:
MontyHall(switch = T, n = 125, seasons = 10)$plot
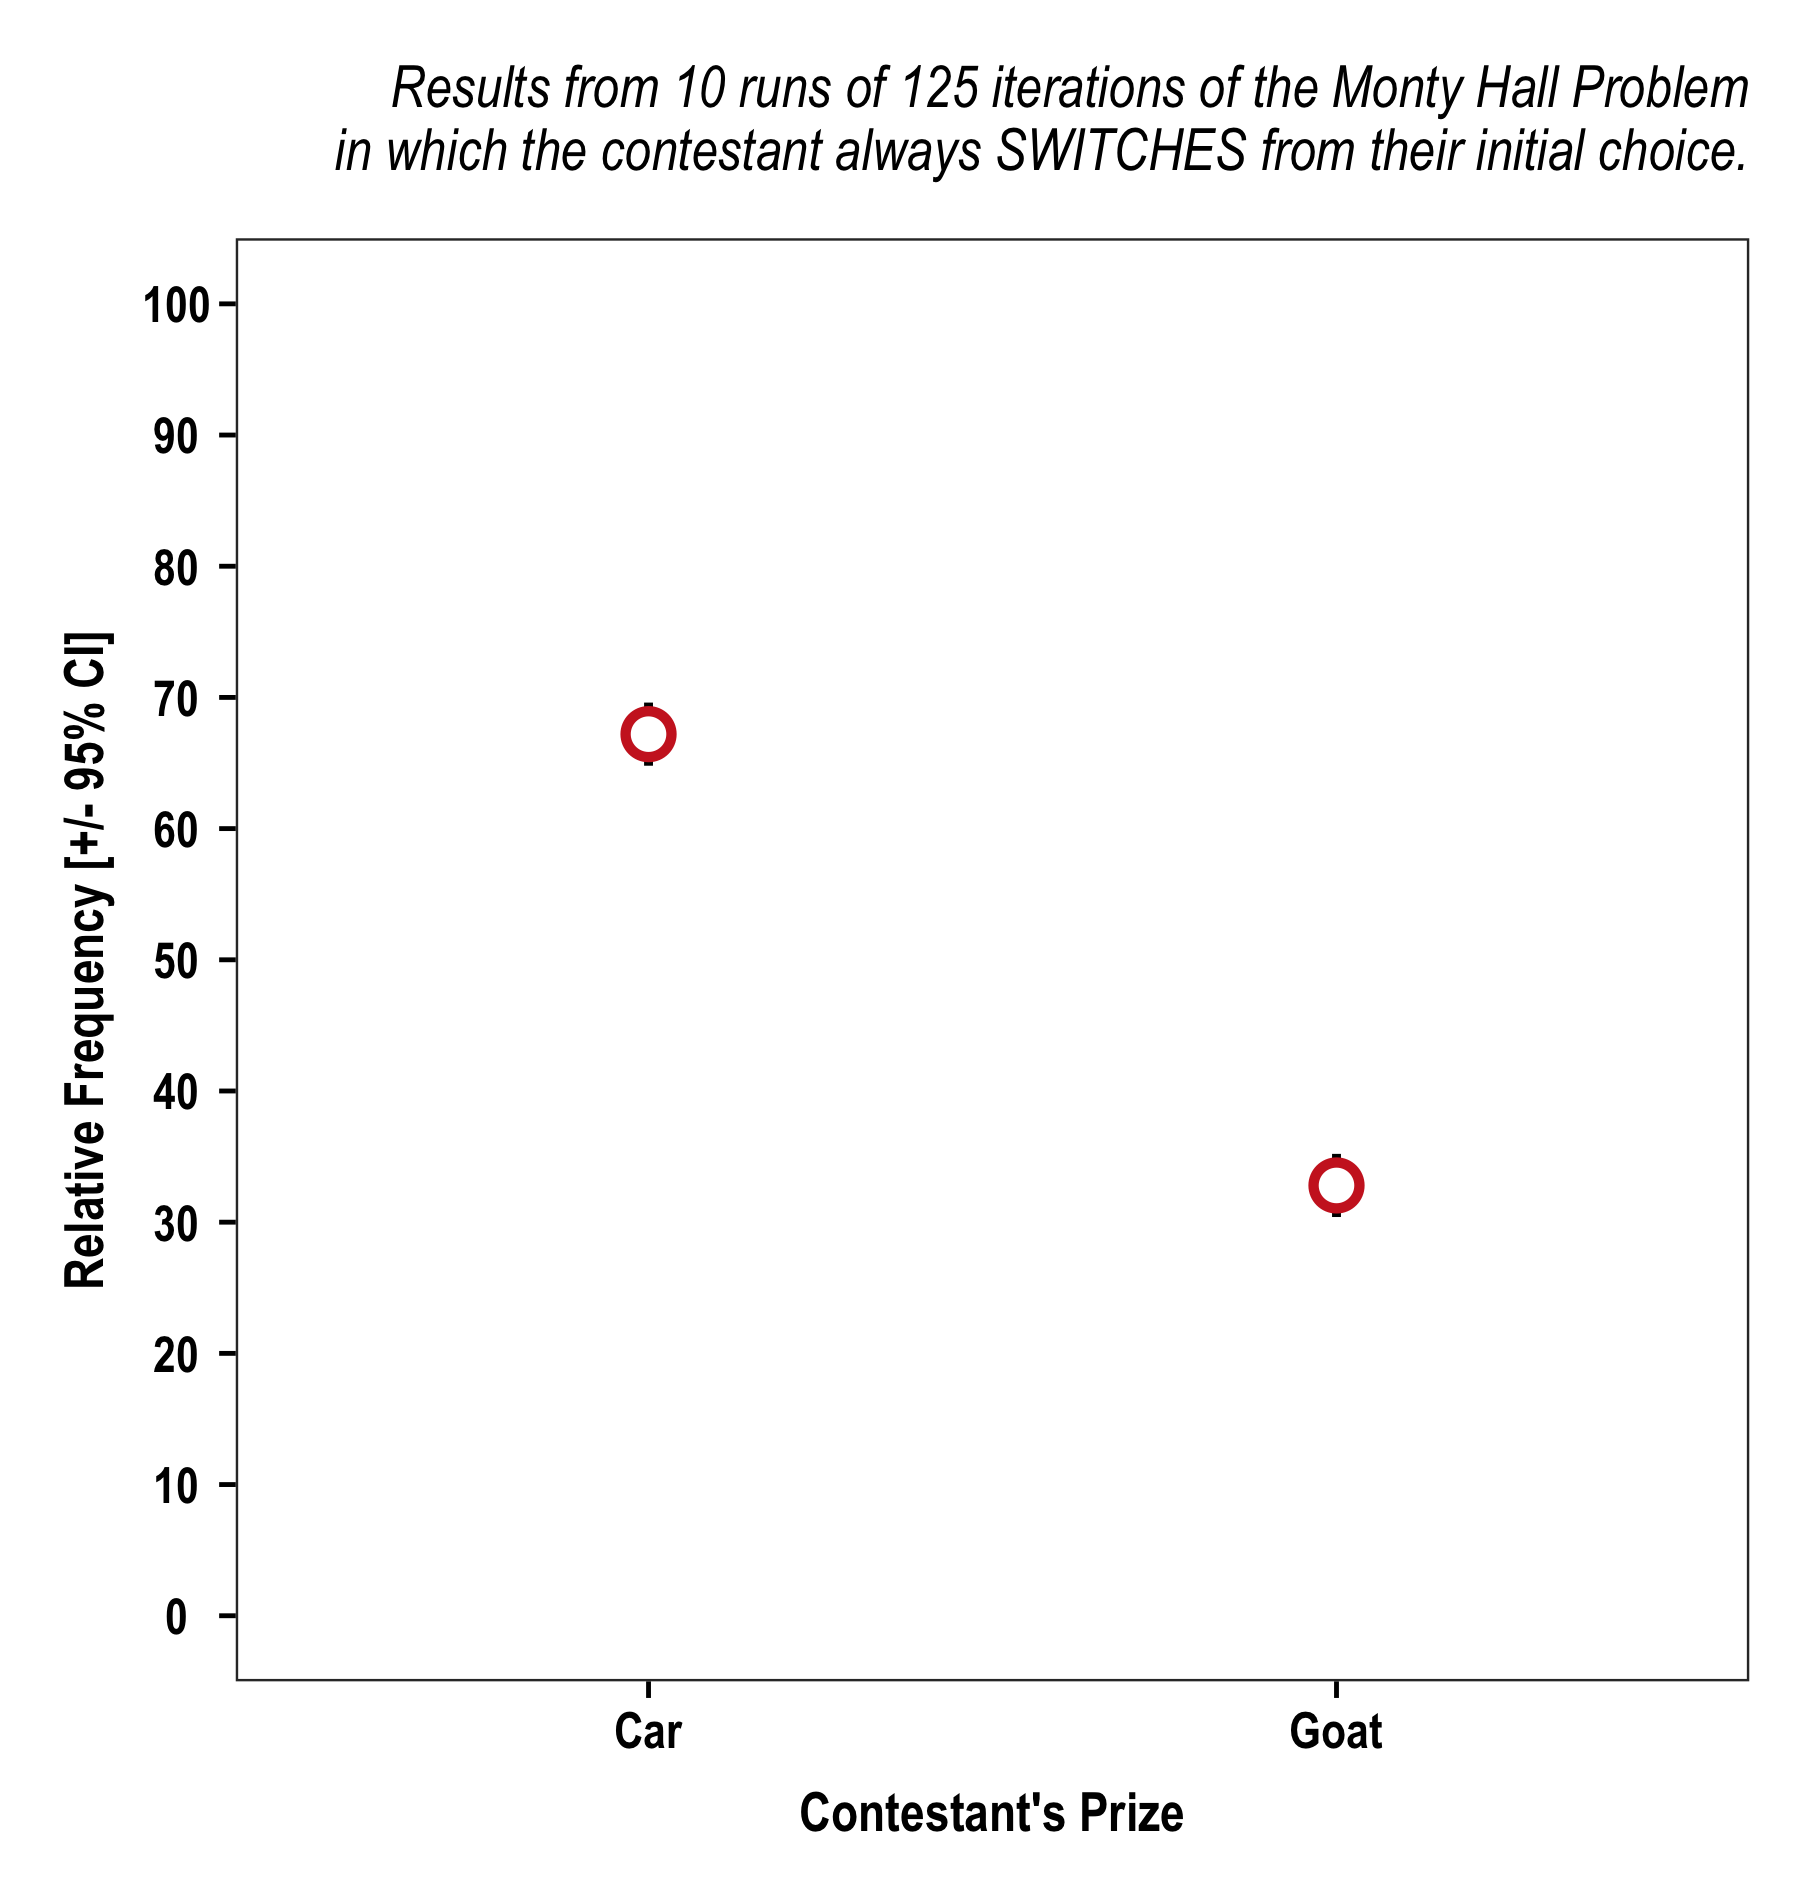
The results of these simulations confirm that you have a 1/3 chance of initially picking the door with the prize. If you stay with that choice you will win about ~33% of the time and correspondingly if you switch you will leave the winning door that same ~33% of the time, but end up winning ~67% of the time.
–
For those interested, the full code is here.