The 2023 Major League Baseball postseason has included some “upsets” that have people questioning whether the playoff format is fair. This happens whenever a perceived favourite does not win. The Braves, Dodgers, and Orioles all losing is taken as evidence of something wrong with the system. Ideas for improving the system generally focus on there being too much time off between series and that the advantage of having one extra home game is not enough. But the reality is that short series don’t work if the goal is to determine the better team. If you want a system for baseball that helps determine who the best teams are we already have it: the 162 game regular season. In a short series, say 3- or 5-games, the difference in quality between teams is not strong enough for the “better” team to consistently win. If you project a 100-win (0.617 winning percentage) team’s record over 5 games you’d expect them to win 3 and lose 2. If you do the same thing with an 82-win team (.506), you’d expect them to win 3 and lose 2. Admittedly, rounding is doing some heavy lifting in those projected records but the point is that teams that were 18 wins different over the 162 game regular season end up looking awfully similar over a smaller set of games. The larger differences that emerge over a season are reduced to almost nothing. But we pay way more attention to how a team performs across 3 games when the calendar turns to October than we did when it turned to May, June, or, well you get the point. Luck and variance play huge roles in these short series but their influence is rarely acknowledged to the extent it should be because it is annoying for fanbases to be told that it was just an unlucky couple of games; it is much more interesting to point to a managerial choice or a baserunning mistake or some mythical combination of heart, hustle and psychology.
This latest round of baseball playoff consternation reminded me of a conversation I had with a friend about randomness in sport. Our conversation originated from me mentioning a comment that Nate Silver may or may not have made at a conference many years ago:

I argued that the role of luck/chance is much larger in baseball and hockey than it is in sports like basketball or football and as a result you will see more positive results for poor teams, which makes predicting games more difficult. This isn’t because baseball players or hockey players are less skilled at their games than basketball and football players are at theirs. It is just that elements of the way the sports are played and correspondingly the ways leagues are designed reduces the extent to which differences in skill can separate teams. My friend suggested that looking at the variability in winning percentage across sports would be informative for responding to this issue. Greater variability in winning percentage is indicative of skill playing a greater role than luck; if it is all luck (games are essentially coin flips) then teams should converge on a 0.500 winning percentage. He is right and it turns out we are not the first people to have this discussion (e.g., this, this, or this) and I could have just sent a link to this Vox article and been done with it. But I decided to do some analysis to confirm and expand upon that article and add some figures of the data.
To assess variability in winning percentage across sports, I scraped season standings tables for Major League Baseball (MLB), the National Hockey League (NHL), the National Basketball Association (NBA), the National Football League (NFL), and the English Premier League (EPL) from the Sports Reference family of sites. For MLB, the NBA, and the NFL things are straightforward; winning percentage is the ratio of wins to games played. In these leagues, teams are incentivized to win and ties can’t happen (MLB, NBA) or are extremely rare and considered half-a-win (NFL). Things are more complicated in the NHL and the EPL because of the frequency of ties, the incentivization of ties, and the differential in points-earned between a win and a tie. The NHL, due to multiple changes in the way their standings are calculated, is the most complicated. Prior to the 1999-2000 season, teams earned two points for a win, one point for a tie, and no points for a loss. But since 1999-2000 teams have earned a point for getting to overtime, regardless of the game’s final result. Effectively this considers getting to overtime a tie. The point that is earned for doing so, dubbed the “loser point”, changes the way teams play. Teams can go after that extra point and win in overtime but just getting there ensures a single point. Moreover, since the 2005-2006 season there are no ties because games go to shootouts if things remain tied after an overtime period. Again, this will change how teams play at the end of overtimes; it might be better to take their chances in a shootout then press for a win at the end of the period. In the EPL the complication is that teams earn three points for a win, one point for a tie, and no points for a loss. So teams are incentivized to win, even more so than in the NHL, but they gain points for ties, which changes how they play toward the end of games. Due to the issues with ties in the NHL and EPL I chose to work with points percentage (ratio of points earned to possible points) rather than win percentage.
For each of the five leagues, seasons since 1995 are included. I removed seasons in which there was a lockout (NBA: 1998-1999, 2011-2012; NHL: 2004-2005, 2012-2013) or pandemic (MLB: 2020; NHL: 2020-2021) that reduced the number of games below the typical total. In the end I am working with 28 seasons for the EPL and the NFL, 27 seasons for MLB, 26 seasons for the NHL, and 25 seasons for the NBA. Here are the distributions in win percentage for these leagues:
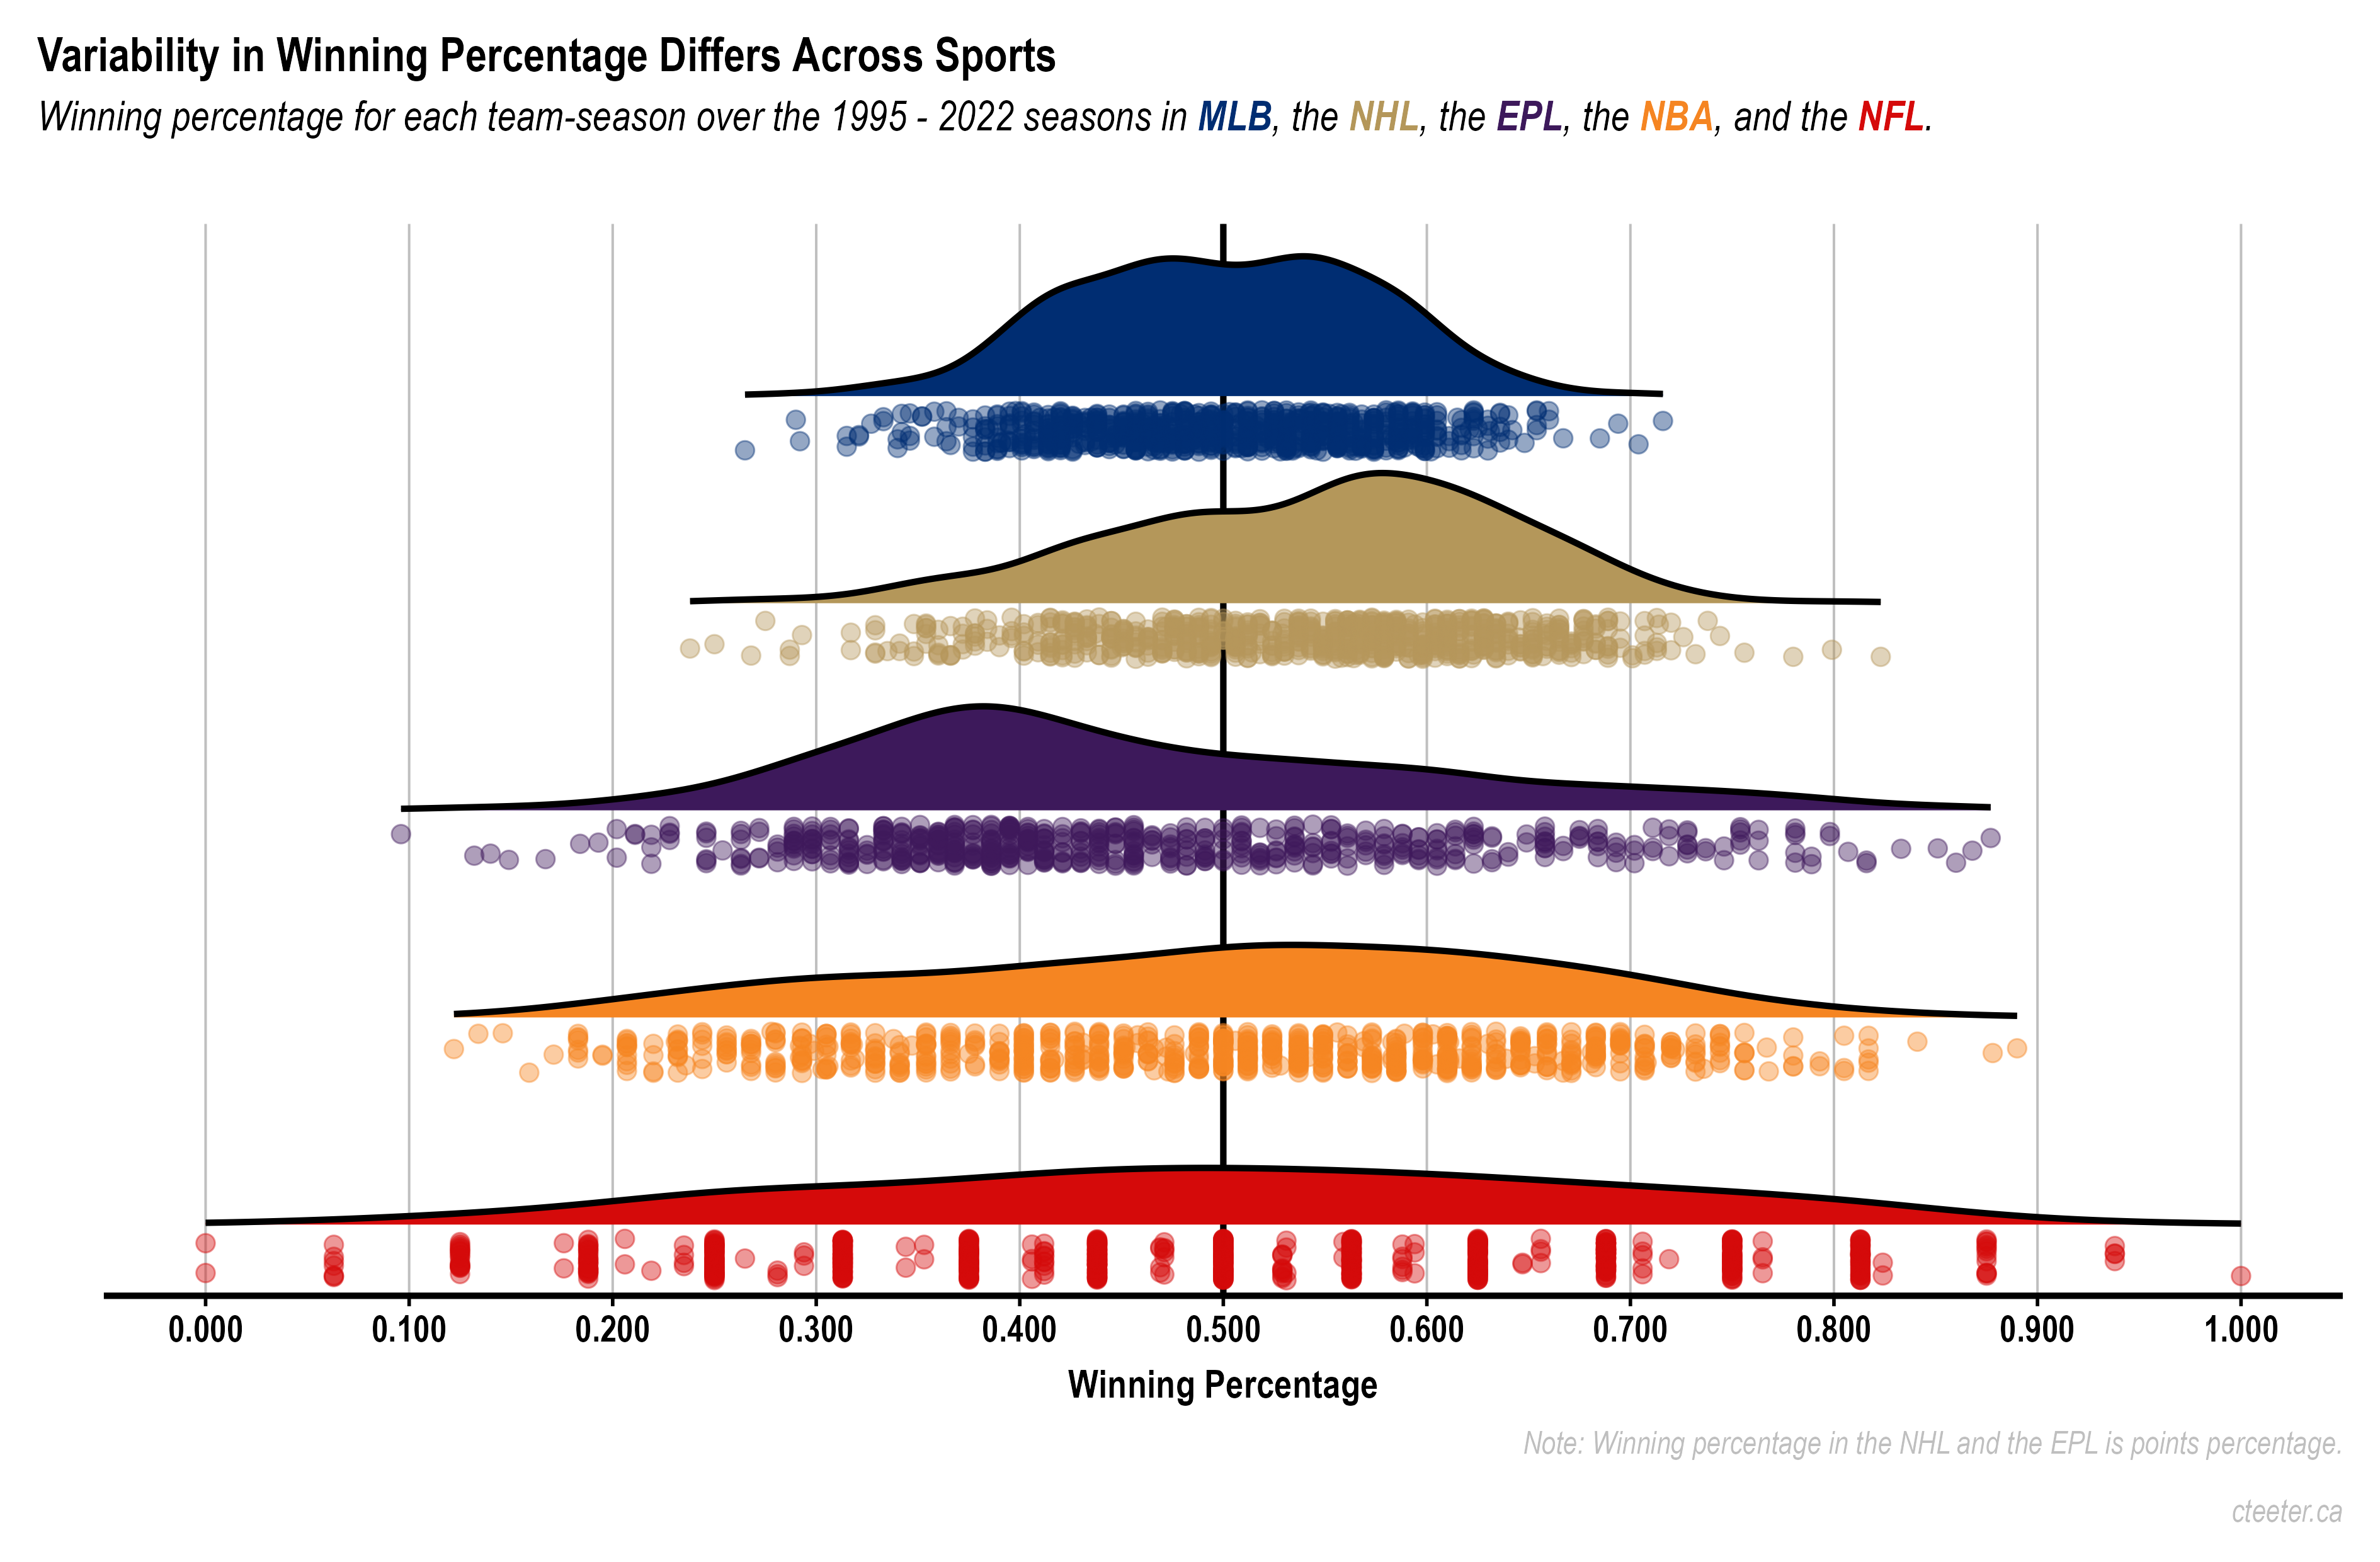
This fits with the idea that the role of luck/chance is much larger in baseball and hockey than it is in basketball and football. There is greater variability in winning percentage in basketball and football, which suggests that skill is playing a stronger role in differentiating teams. But the number of games also matters. Baseball teams play 162 games, football teams play 16. If you flipped a coin and it came up heads all 16 times you’d certainly be surprised but not nearly as surprised as you would be if it came up heads 162 times. There are NFL teams who have won all of their regular season games, there is not a baseball team that has ever come close. This makes the comparison between the NHL and the NBA interesting as both leagues involve 82-game seasons; the possibility for ties and allocation of points for tieing in the NHL makes the comparison less apples-to-apples than I would like. The spread of winning percentages in the NBA is greater than in the NHL, again suggesting that skill is differentiating teams more than luck.
As discussed in the Vox article linked above and introduced for differentiating sports leagues by leading sabermetricians we can attempt to quantify the amount of luck involved in sports using a statistical rule about adding variances. The observed variance in winning percentages across leagues is the spread that you can see in the figure above or this:
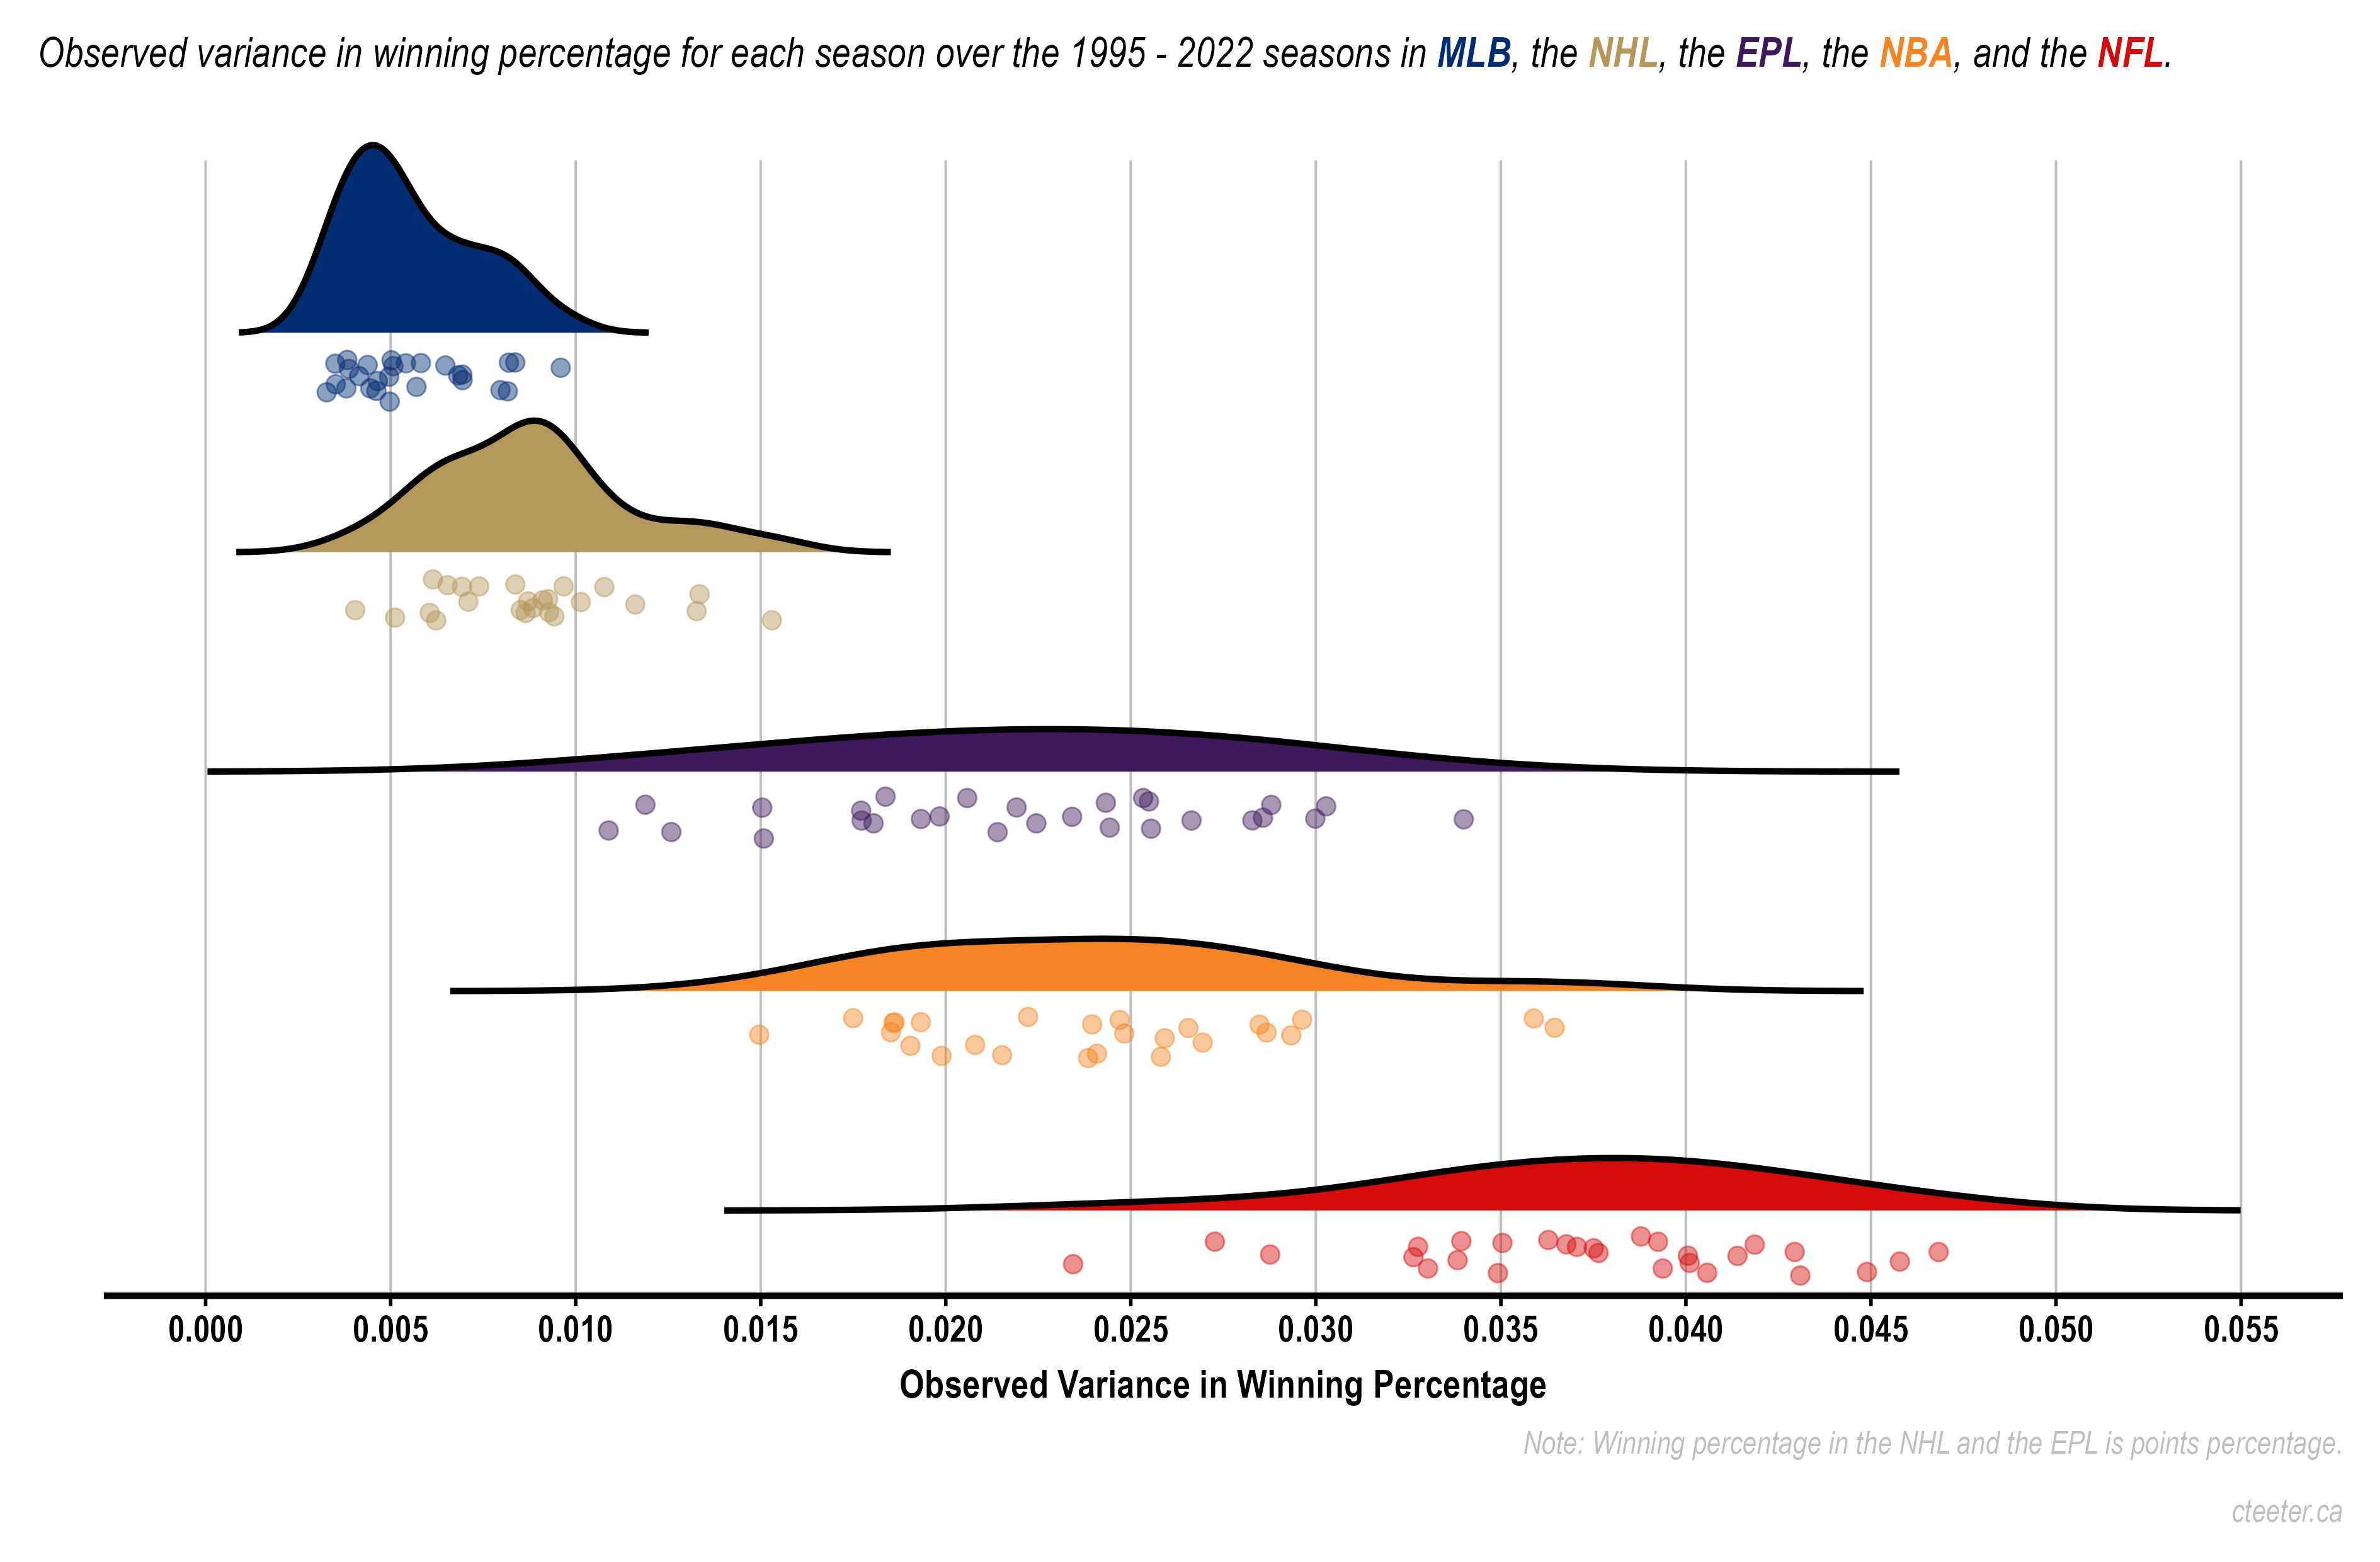
This observed variance is a result of variance in skill plus random variance from things like luck/chance. Fortunately we can estimate the random variance by treating games like coin-flips. Then by removing this random variance from the observed variance we will be left with the variance that is the result of skill. The table below presents the results by league:
| League | Season Games | Observed Variance | Random Variance | Contribution of luck |
|---|---|---|---|---|
| NBA | 82 | 0.0233 | 0.0031 | 13.3% |
| MLB | 162 | 0.0054 | 0.0015 | 27.8% |
| EPL | 38 | 0.0210 | 0.0066 | 31.4% |
| NHL | 82 | 0.0090 | 0.0031 | 34.4% |
| NFL | 16 | 0.0362 | 0.0156 | 43.1% |
To some extent the last column shows how reliable a team’s winning percentage is demonstrative of its skills. In the NBA it is a lot, there is hardly any luck. In the NFL there is considerably more luck involved, a lot of which is a result of the small number of games played in an NFL season. It is perhaps impressive that the contribution of luck is not higher with so few games. 16 baseball games would tell you very little about the team’s quality, so using two playoff games to make bold claims about the underlying amazingness and mental fortitude of a baseball team is real silly.
The numbers I arrive at in the table deviate a bit from those shown elsewhere and suggest a re-ordering of the luck/skill spectrum presented in the Vox article linked above. The differences are likely because I am using a much larger set of seasons (~25), whereas that analysis used only 5. Again, there is more variance in smaller samples so it is possible the 2006-2011 seasons the author used are not representative of the sports on the whole. Regardless, this analysis approach supports the idea of there being more contribution from random variation to team performance in hockey than in most other sports which makes it harder to predict. Hockey is not entirely random as Nate Silver, perhaps sarcastically, suggested but it is certainly subject to much more randomness than basketball.
Sports are great.