Another month of baseball is almost in the books and I find myself re-annoyed with the increased attention to baseball’s pace of play problem and all the calls for major league baseball to do something about it. Perhaps it stems from years of being one of the few baseball fans among my friend group and constantly feeling the need to defend the sport against football, hockey, and (occasionally) basketball, but I think the idea that baseball is too slow and needs to be corrected in order to attract fans is silly. Baseball does not have a pace/length problem. It has an on-field action problem. As simple evidence of this, look at the following numbers from the 2018 season-to-date:
Strikeouts: 5,562
Hits: 5,174
You are reading that correctly. Through Sunday’s games, batters have turned heel from the batter’s box to find a spot on the bench 388 more times than they have run to (at least) first base safely. That is astounding. And it is new. This is the first season in which strikeouts have outpaced hits. Joe Sheehan has been tracking this trend for a few weeks. I have been following along and wanted to dig into it further. First, here is the hits:strikeouts ratio for the 1961 to 2018 seasons, see if you can spot the recent trend:
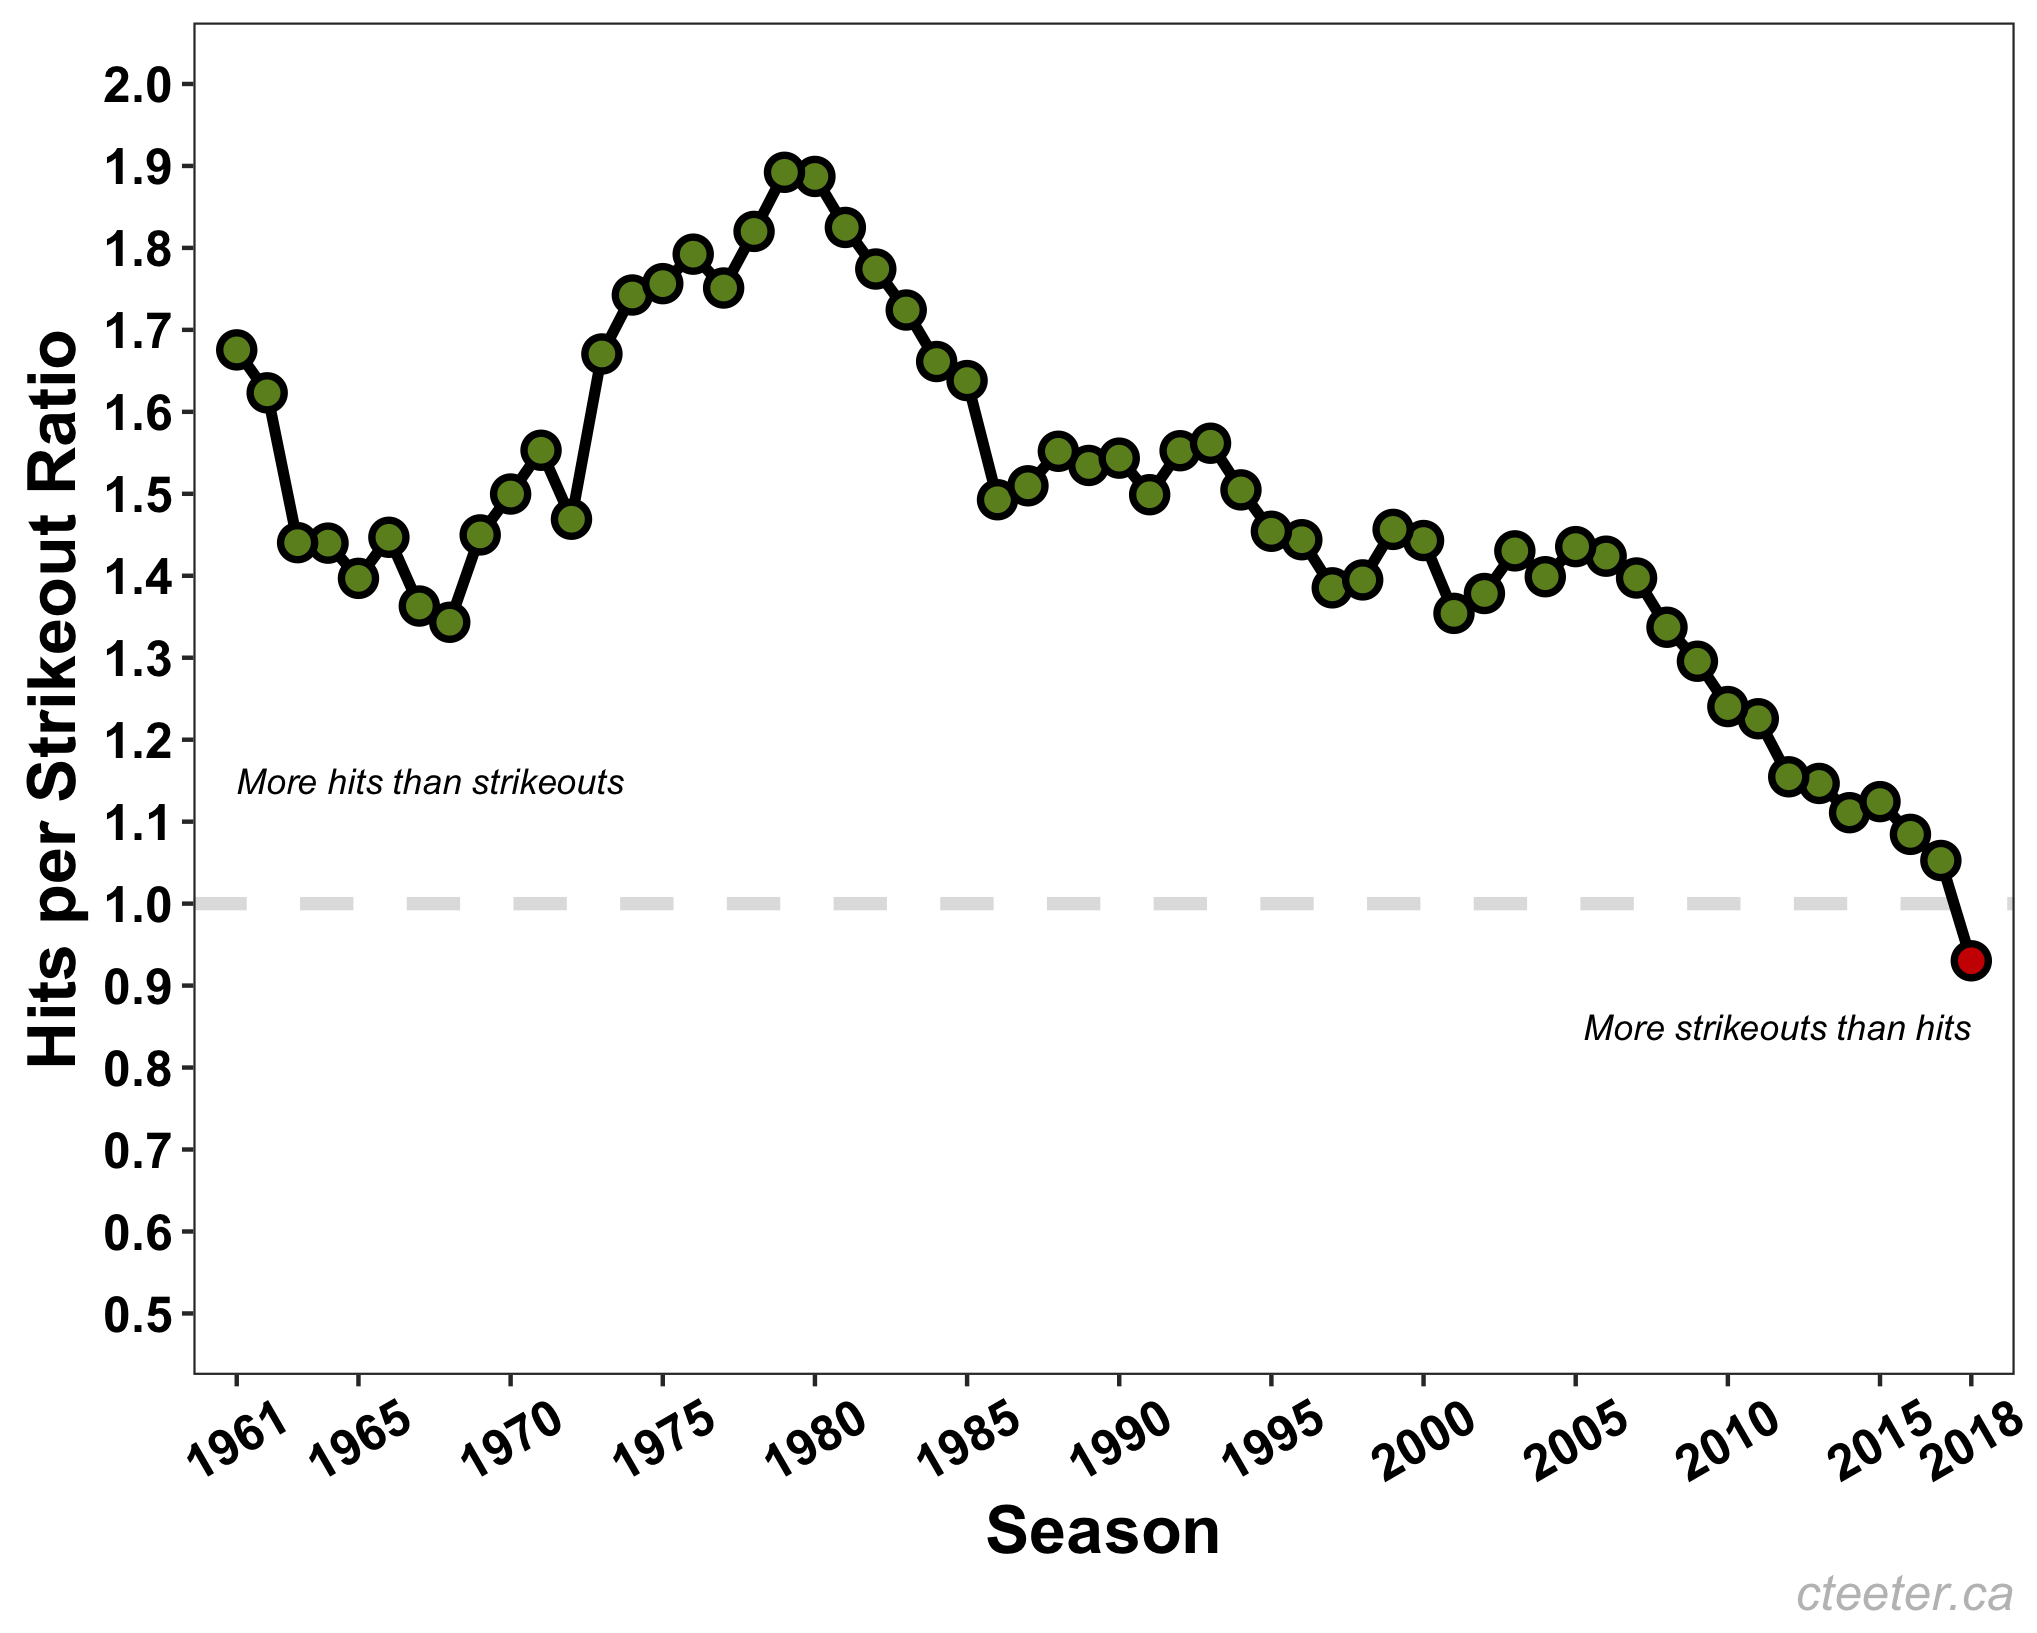
I can hear you screaming at me that the figure above compares one month – and a bitter cold one at that – for the 2018 season to full seasons for the other years. I agree that is a poor thing to do, but it turns out that limiting things to just March/April doesn’t change the story:
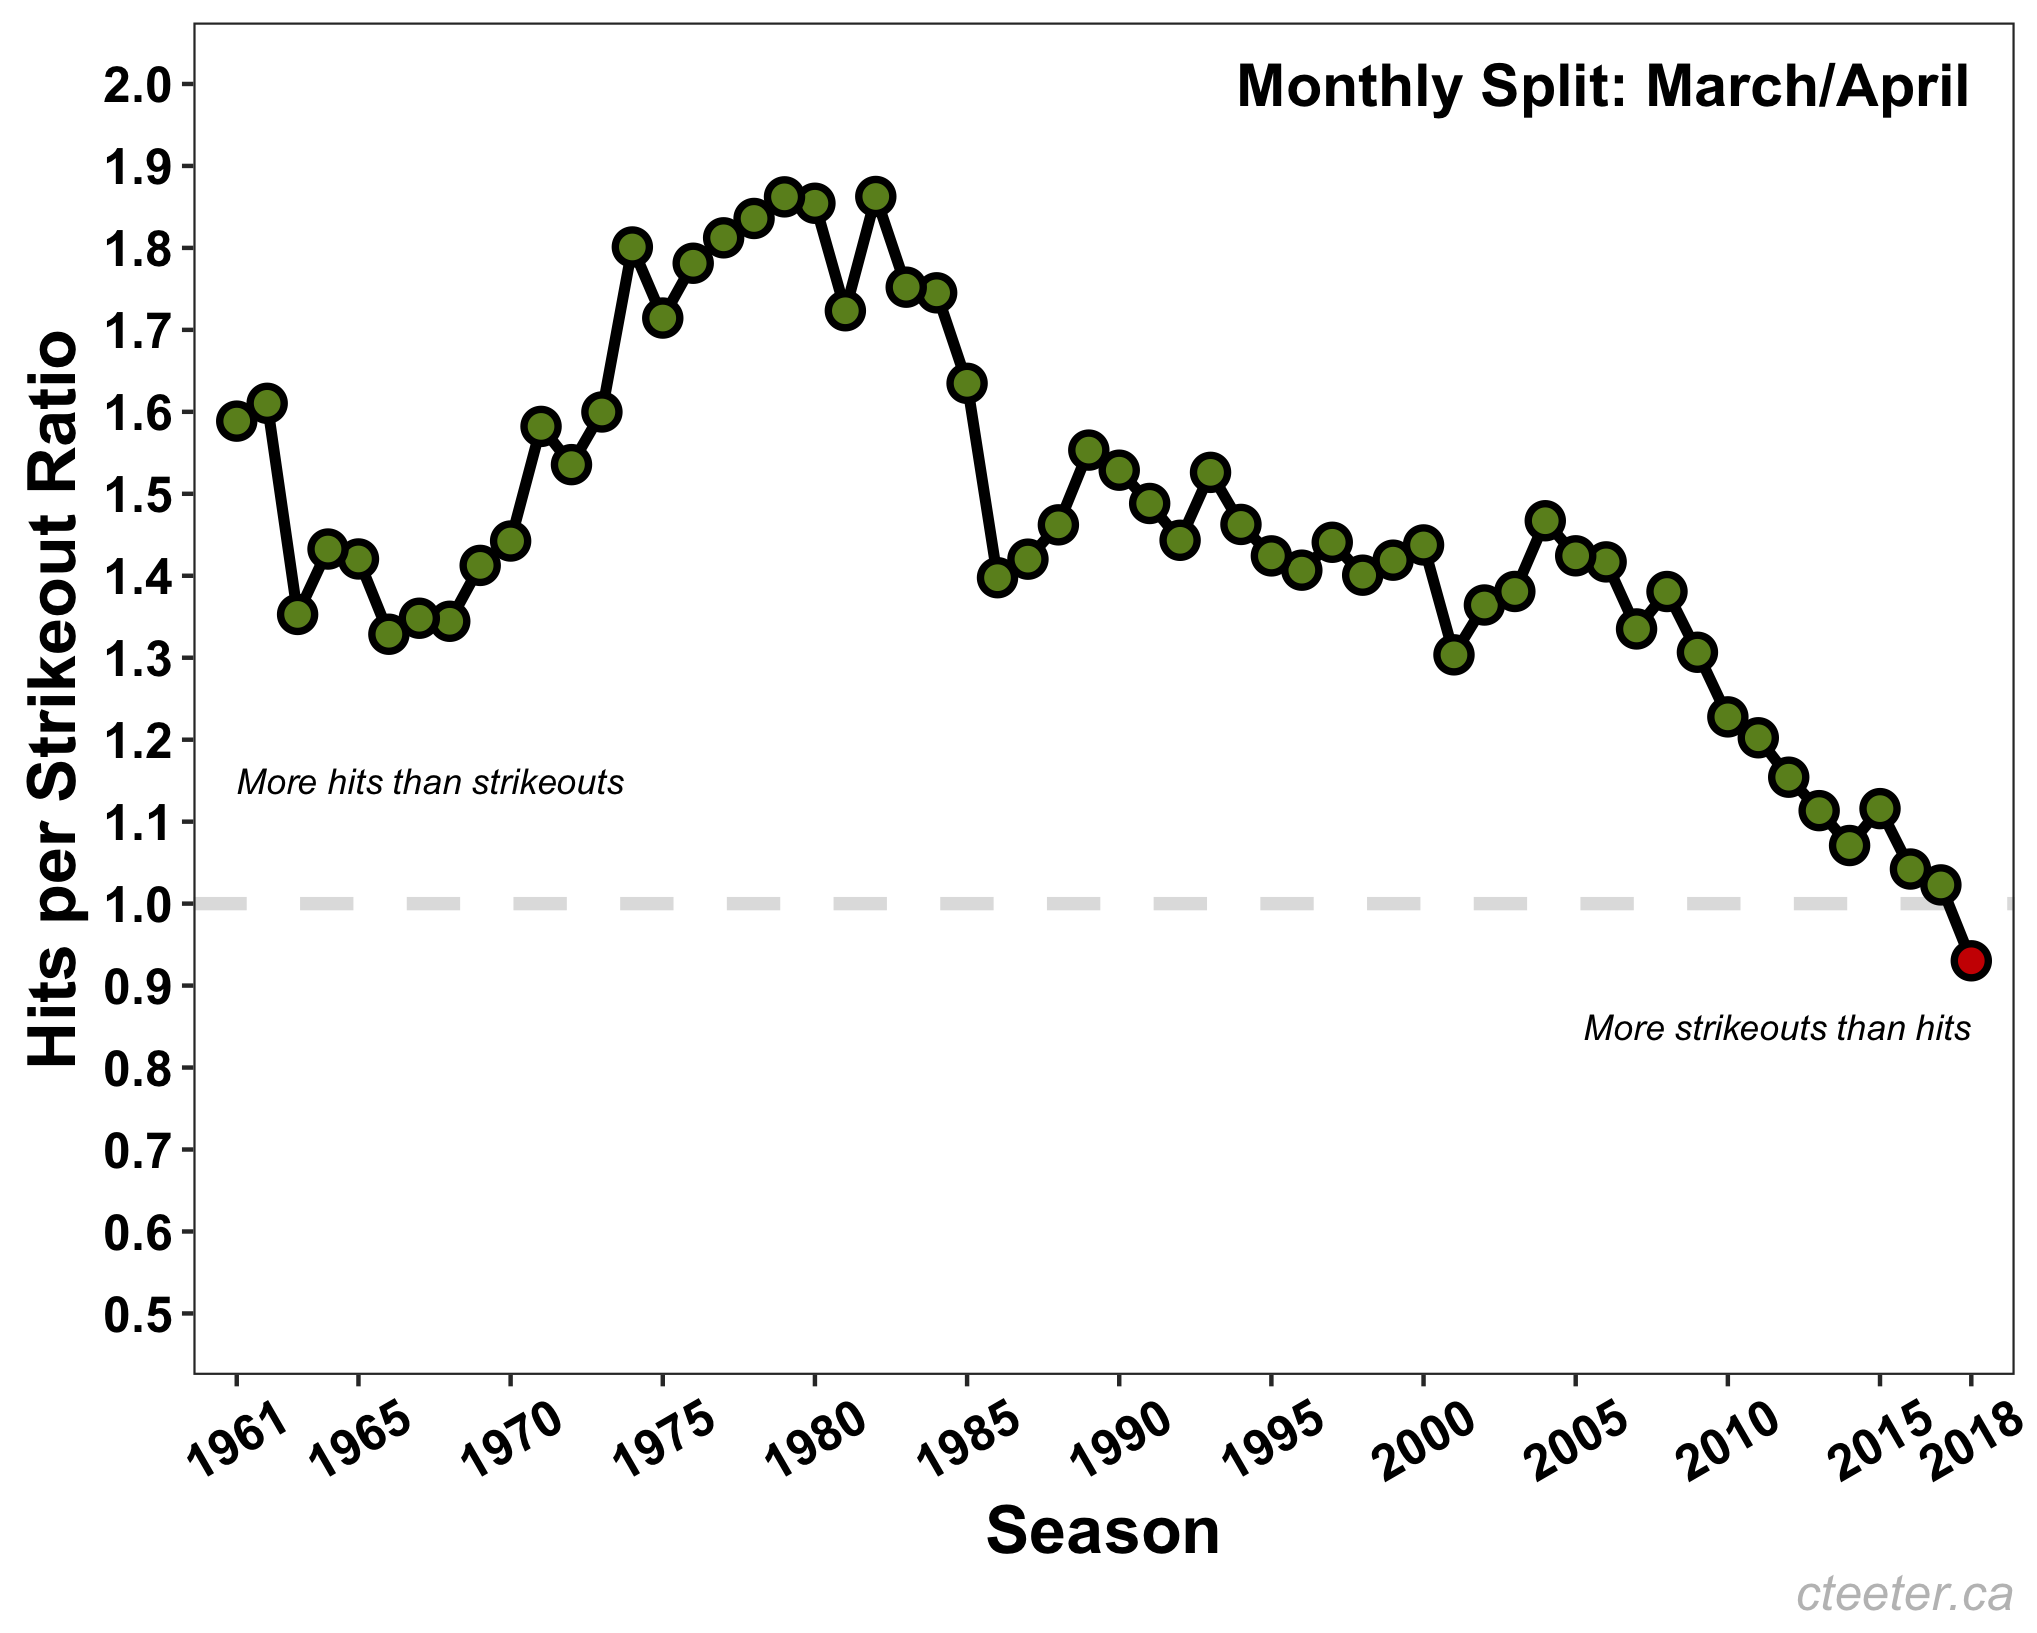
There are eight days left in the month, so there is a chance that things get back over that hits:strikeouts breakeven line, but it seems extremely unlikely. Going back to 1908, the first year for which I can grab data from Baseball-Reference (thank you!), there has never been a month in which batters have racked up more strikeouts than hits. March/April 2018 will be the only time, well at least until May 2018, and on and on. This is an awful trend and is the problem baseball has. When a batter strikes out the movement on the field is minimal. It makes life easy for the camera men and women capturing the game for us at home, but there is no action. When the ball is in play everybody on the field is moving. It is a great and a truly underappreciated part of the sport. Even the routine 6-3 provides something more than strike three thwacking into the catcher’s mitt.
The ball is just not ‘in play’ as often anymore. Thus far in 2018 the percentage of plate appearances that don’t end in a strikeout or a walk is 67.85. I left home runs as balls-in-play because they at least involve some movement on the field and excitement (depending on one’s perspective, of course). 67.85% is the lowest ever (since 1908), and, as even the simplest of linear relations shows, the trend over the last 50 years is not good:
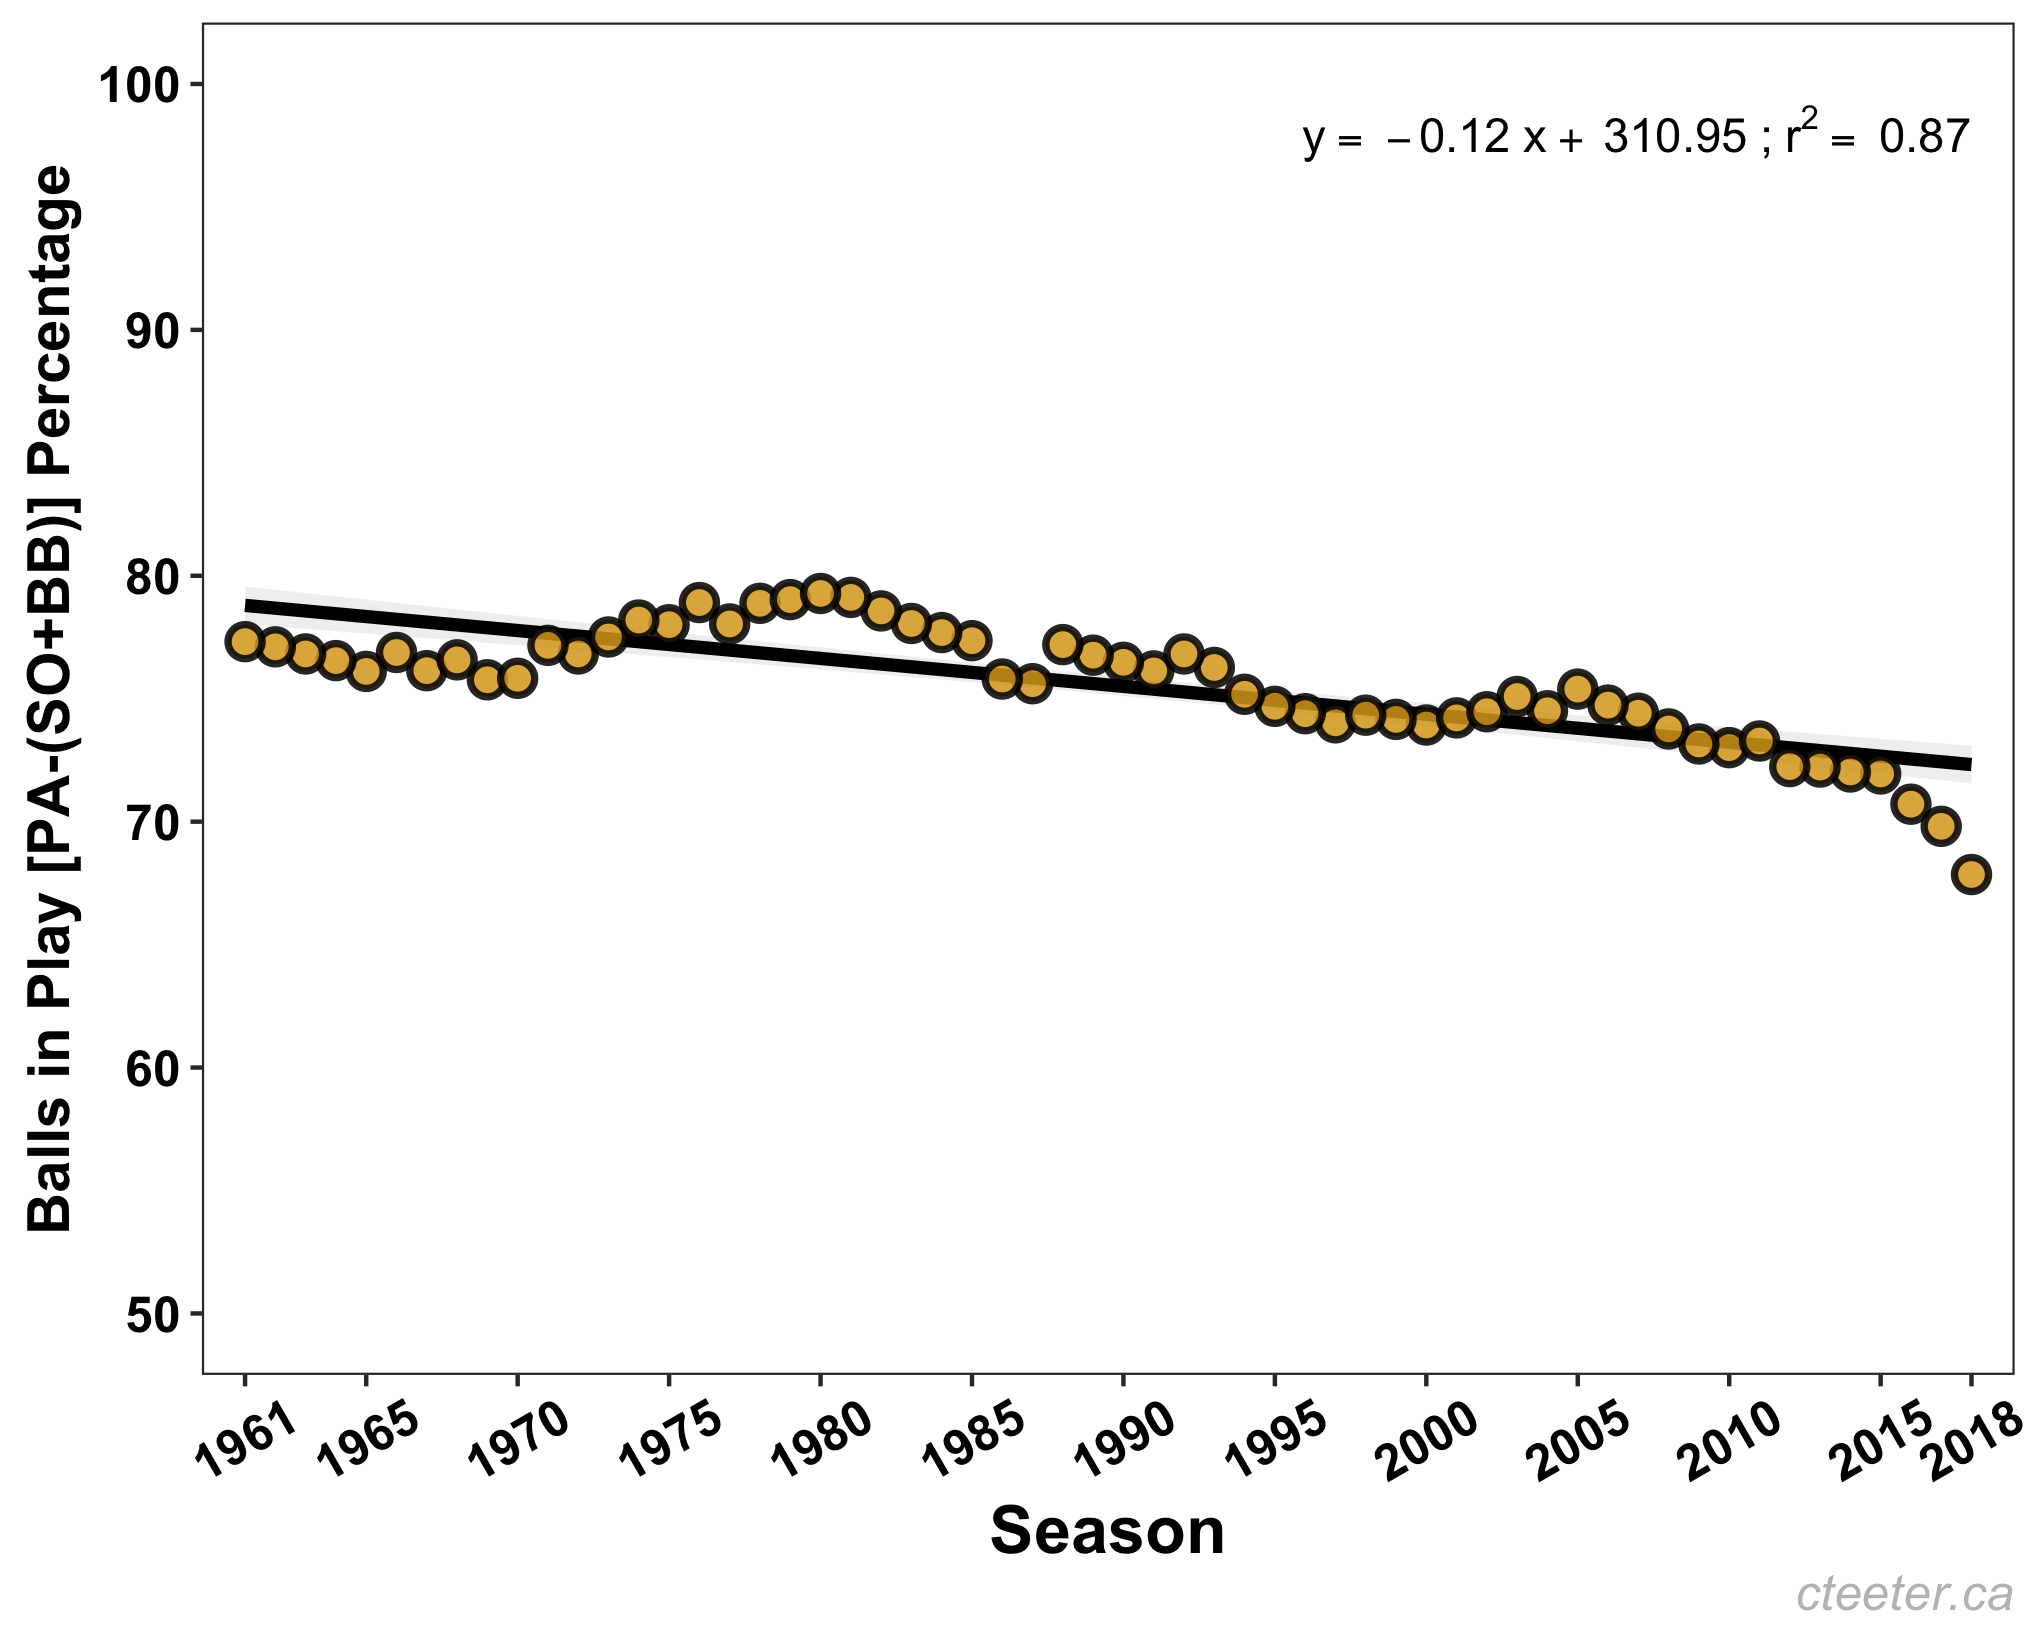
Limiting things to only March/April doesn’t change much (r2 = 0.77).
This is baseball’s problem. Not pace or length. Inaction is the issue. I don’t think people would be complaining about pace and/or game length if it was 3.5 hours of the ball being knocked all around the yard. Maybe this is pedantic, but it is not just pace/length that matter, but what happens in the interim. Right now, it is taking a long time and not much is happening. That is an ugly combination. Football games take three(ish) or more hours to play, but I am not seeing many pleas for the NFL to speed up its game. I think the reason for this is simple: even on an incomplete pass, or on a handoff that goes for a two-yard loss there are 22 bodies moving around the field. This all gets perceived as ‘action’, despite nothing of real consequence having happened. This action, real or not, is what baseball has been lacking over the last five-plus years. More and more the game only involves the pitcher, catcher, and batter, without any need to change the camera angle. Even though a baseball is being thrown 95mph, often with expert precision, it doesn’t look busy on the screen, so it codes as inaction. And unfortunately for Rob Manfred and company, no amount of bullpen carts, limits on mound visits, limits on batting glove adjustment, limits on time to make a replay decision is going to change this fact. In between all those initiatives the game is stagnant, and even despite them, on average, 9-inning games are only slightly shorter than they were last year and are still longer than they were in recent history.
| Year | Season Average (mins) | March/April Average (mins) |
|---|---|---|
| 2018 | 181 | 181 |
| 2017 | 185 | 184 |
| 2016 | 181 | 181 |
| 2015 | 176 | 174 |
| 2014 | 182 | 182 |
| 2013 | 179 | 178 |
| 2012 | 176 | 173 |
| 2011 | 172 | 170 |
| 2010 | 171 | 173 |
| 2009 | 172 | 174 |
| 2008 | 171 | 172 |
Apparently, Rob Manfred is pleased with the numbers in the top row of that table. Sure, games are shorter this year than last, but they are still longer than or as long as games over the rest of the last decade. And he must realize that even if the rule changes are the reason that games are shorter, the difference needs to be substantial for it to affect viewership. Fans aren’t going to suddenly flock to baseball, or resist the urge to follow a different sport because the games take 4 fewer minutes. That is absurd. Getting more action into whatever time-window the game takes is the key. Along these lines, pitch clocks, another pace of play suggestion from the league, might make a difference. Not necessarily because having them will increase the game’s tempo and reduce the time viewers spend staring at a pitcher thinking, but rather because putting pitchers on a time limit is likely to lead to more bad pitches that batters can send into the gaps and get all 10+ guys on the field moving. The game will look busier and more runs will be scored. Fans will appreciate the action. What pitch clocks might mean for pitcher health is another, and very important, question to consider. I suspect the clocks will lead to more injuries and require teams to roster lower quality replacements. This means more offense, which won’t make games shorter, but will make them more interesting to watch.
Get more action in the game and the ‘pace of play’ problem will magically disappear.
Update (May 1, 2018)
The final numbers for March/April 2018 were 7,335 strikeouts and 6,992 strikeouts. So the gap closed a little bit from the date of this post, but not enough to get over the Hits:Strikeouts breakeven line. The 0.95 ratio is officially the first time the ratio has been below 1 in the history of the game.
The percentage of plate appearances that did not end in a strikeout or a walk crept up from the 67.85% it was eight days ago, to 68.27%. This mark is the lowest for any month in the history of baseball by more than one percentage point; the next lowest was September/October of last year at 69.37%.
The issue is getting a lot of attention. There are articles about this issue from national baseball writers in the Wall Street Journal and at Yahoo Sports. Unfortunately there is not much major league baseball can do in-season to correct things. This state of the game will need to self-correct or be shifted by major rule adjustments that are implemented in the next collective bargaining agreement.