I came across a post on the Data is Beautiful subreddit showing NFL home game attendance over the last 20 years and wondered how it has looked in Major League Baseball. So I grabbed team schedules and results, and playoff appearances and successes (i.e., winning league pennant, winning World Series) from Baseball-Reference.com, tabulated MLB stadium capacities from their respective Wikipedia pages, and then put it all together to generate the graphic:

(click image to embiggen)
One thing that jumped out to me is the lack of consistently filled stadia in MLB, especially relative to the NFL. Only the Red Sox have consistently played in front of a filled (or very close to filled) stadium. The stadium capacities in the NFL tend to be higher than those in the MLB and yet many NFL teams fill their venues each week. Of course filling a stadium eight times is easier than filling a stadium 81 times, regardless of team quality. The New England Patriots can put 65,878 folks into Gillette Stadium eight times a year, but an MLB team only needs to get 6,506 people through the gates every home game to match the overall attendance. Both the lowly Rays and Marlins, known for lacking fans in the stands, outdrew the Patriots in 2019.
The second thing that can be gleaned from the figure above, although not easily, is the relationship between team performance and attendance. It is reasonable to expect that when a team is playing well more people will come to watch them play, and vice versa. However the strength of this relationship can vary. For example, the Tigers’ and Royals’ home attendance has been strongly related with winning:
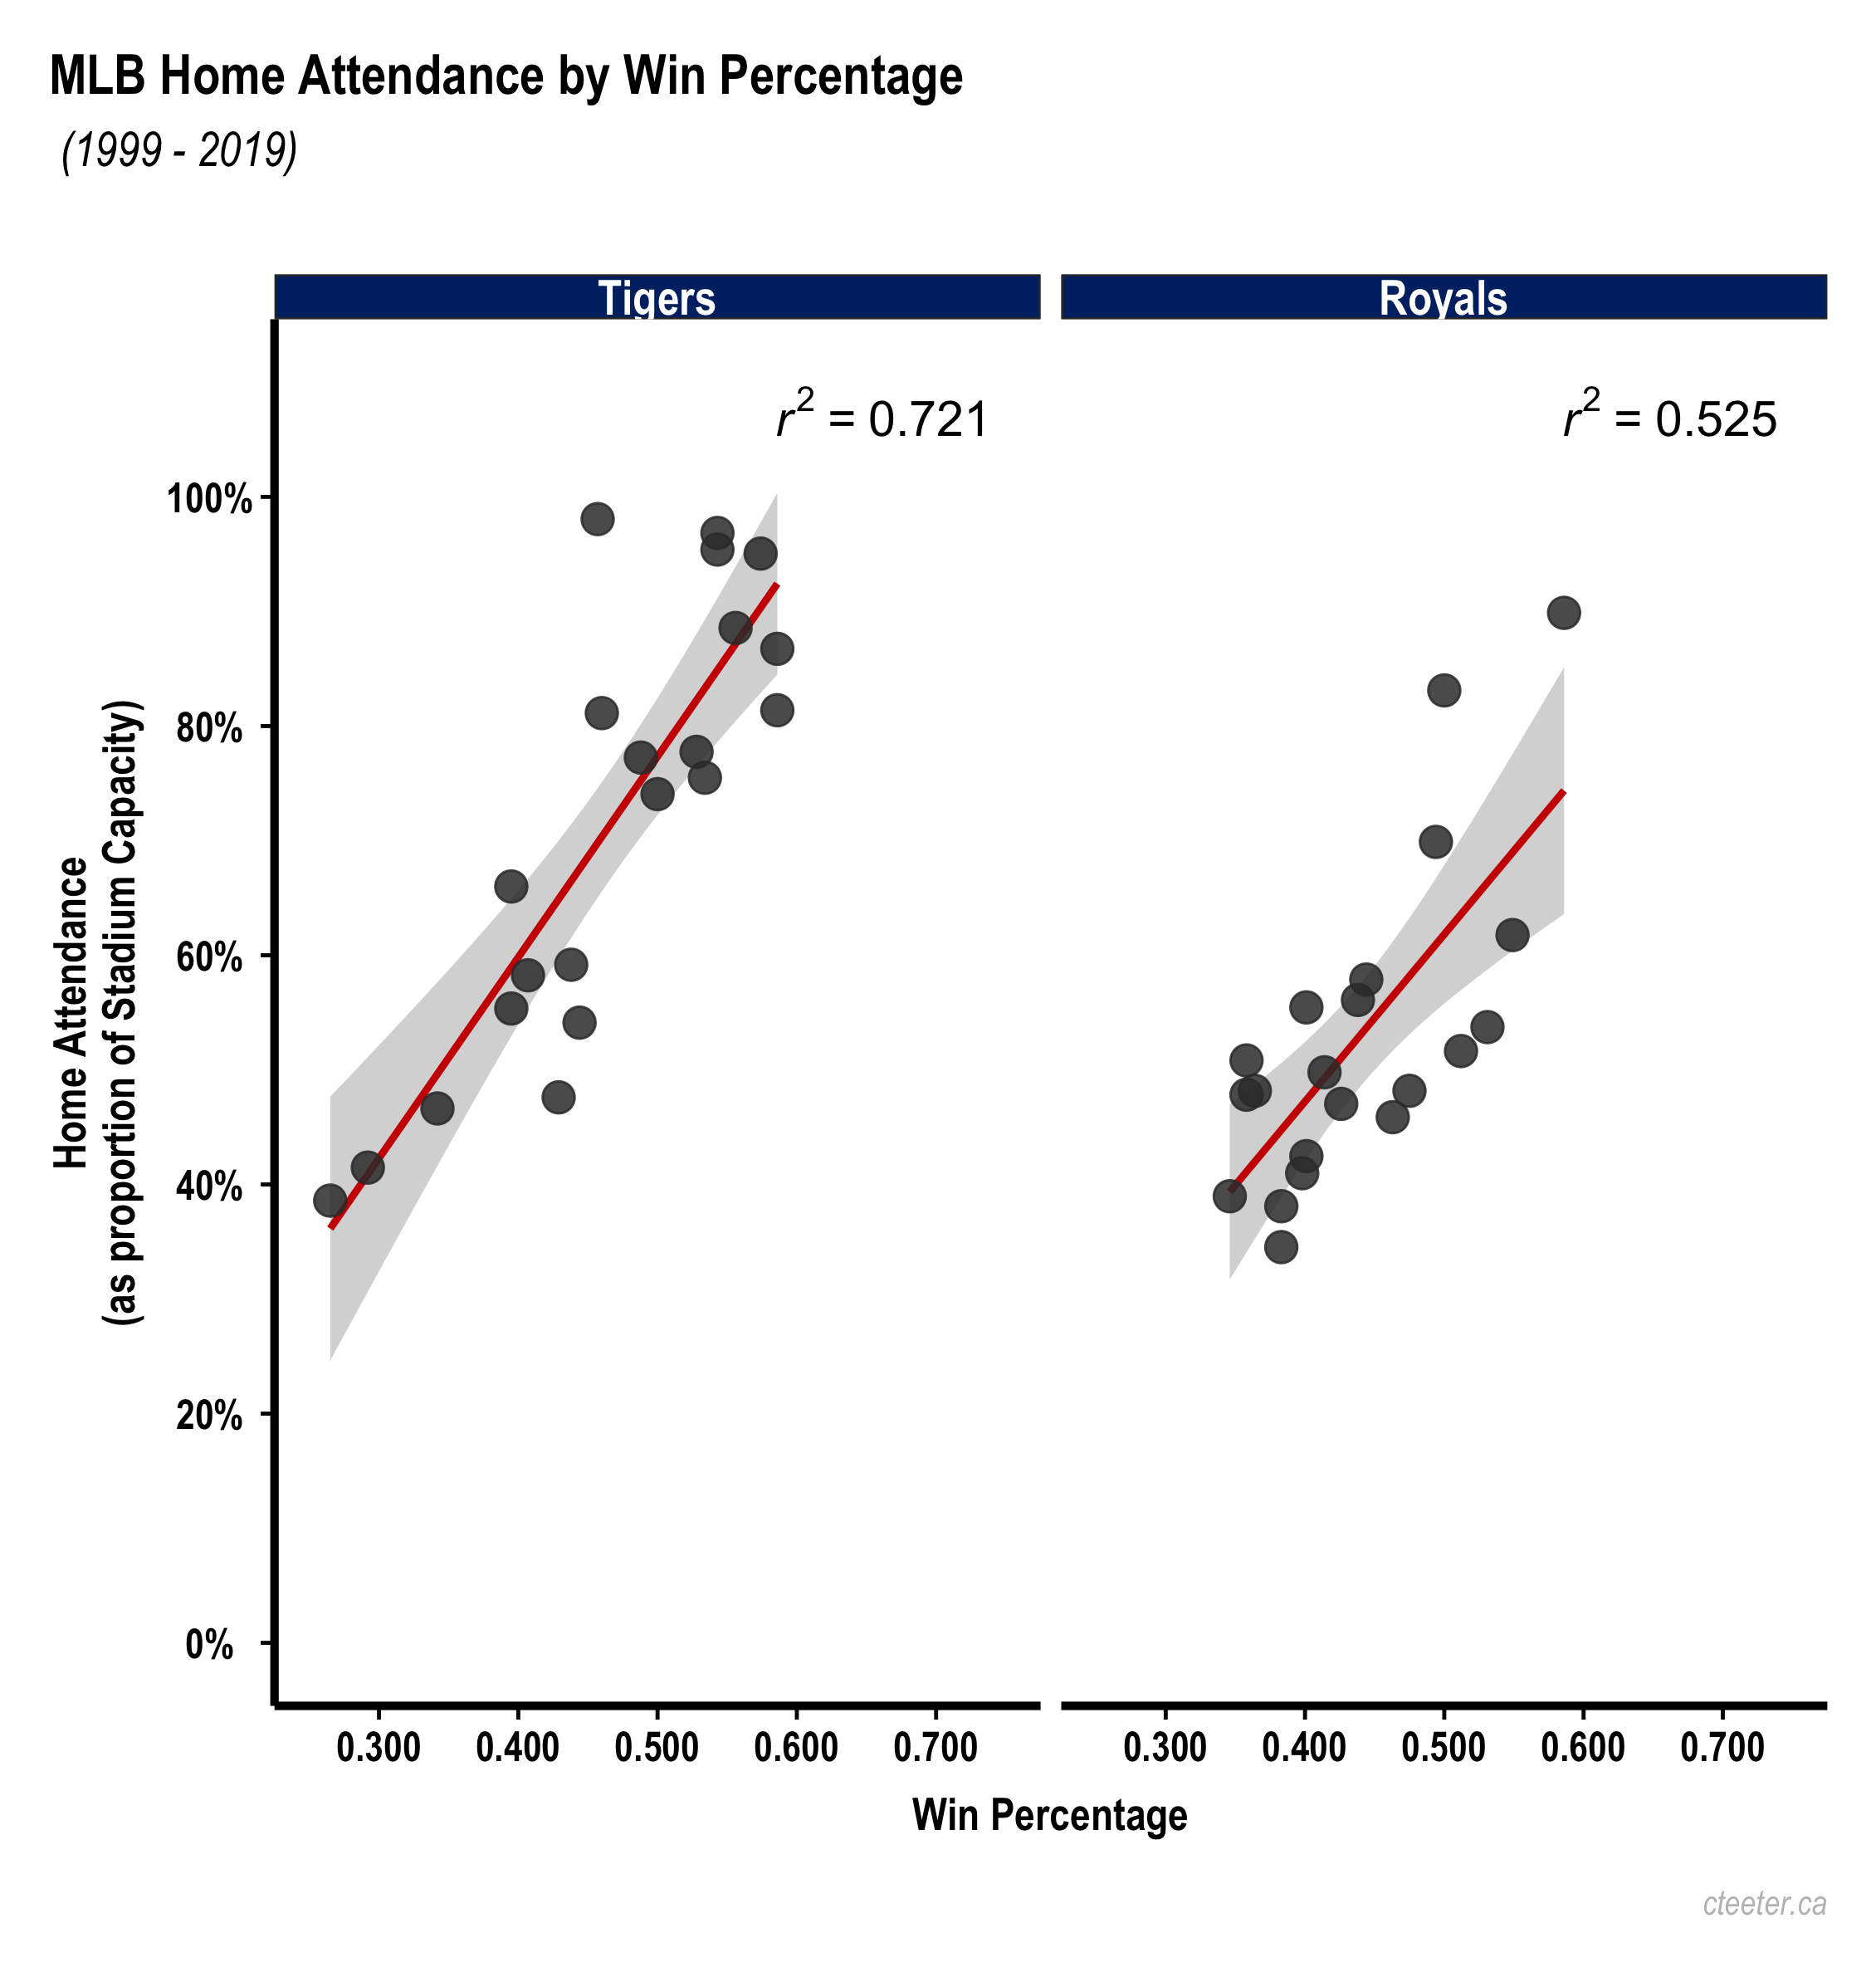
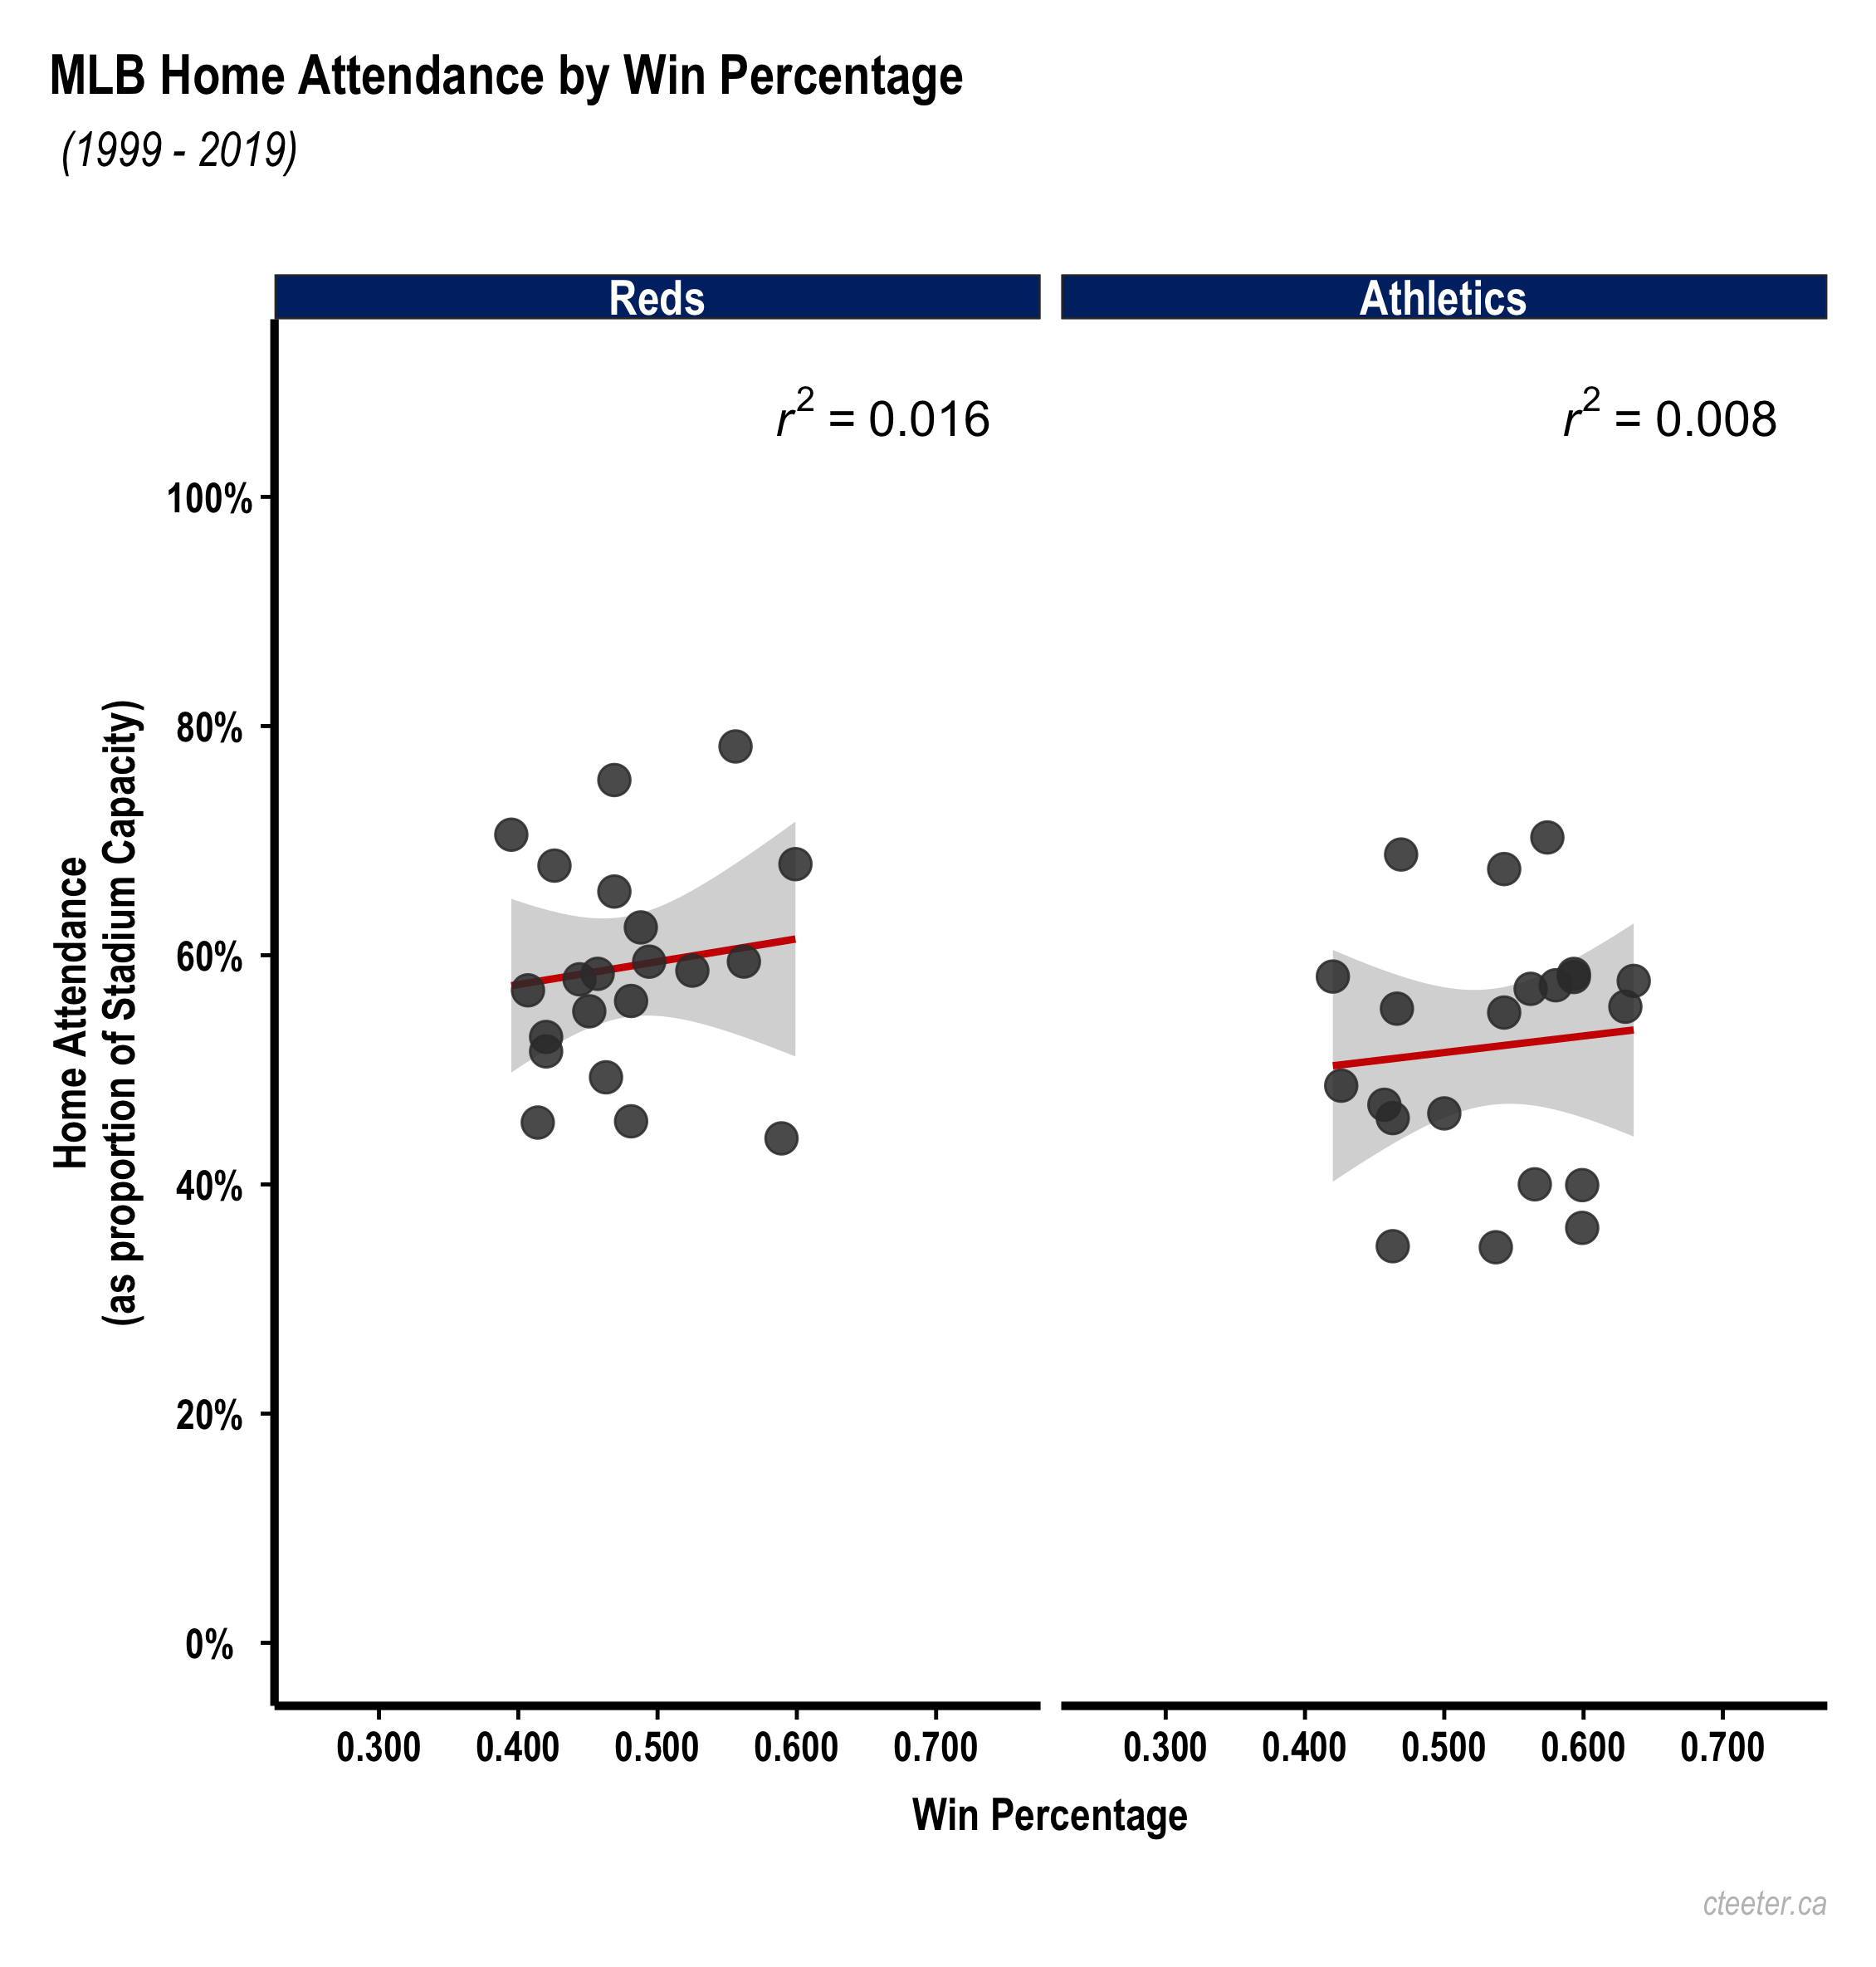
While the Reds’ and Athletics’ attendance has not:
I am interested in seeing how these trends evolve over the next five to ten years. More and more we have seen a decoupling of team performance and revenue, as things like revenue-sharing, local and national television deals, and MLB Advanced Media provide teams with significant streams of money that make them less dependent on ticket sales.
A .csv file with the correlation coefficents between home attendance and winning percentage by team for the 1999 to 2019 seasons is here.
The history of attendance and winning percentage for a single team (back as early as 1969) can also be interesting. For example, the Red Sox, Blue Jays, Dodgers.