Sammy Sosa and Mark McGwire’s home run chase in 1998 is often credited with bringing fans back to major league baseball after the 1994 strike. Cy Young award winners were not thrilled, but fans loved it. These guys (and many others) were launching and the game was fun. In 1998, players combined to hit 5,064 home runs. Thirty-three players hit 30 or more home runs. In 1999 those totals increased to 5,528 and 45. In 2000, they were 5,693 and 47. In 2001, the increases stopped as only 5,458 home runs were hit and just 41 players hit 30 or more. We now look back on this period as the steroids era and have chalked up the ridiculous home run totals to players being juiced-up. It was a wild time, and fans loved it (at the time). The 2019 season made 1998-2001 look like the minor leagues. In 2019, 6,776 balls cleared the walls and 58 players did so 30 or more times. Over 1,000 more home runs were hit last year than in the peak of the take drugs, hit homers seasons.
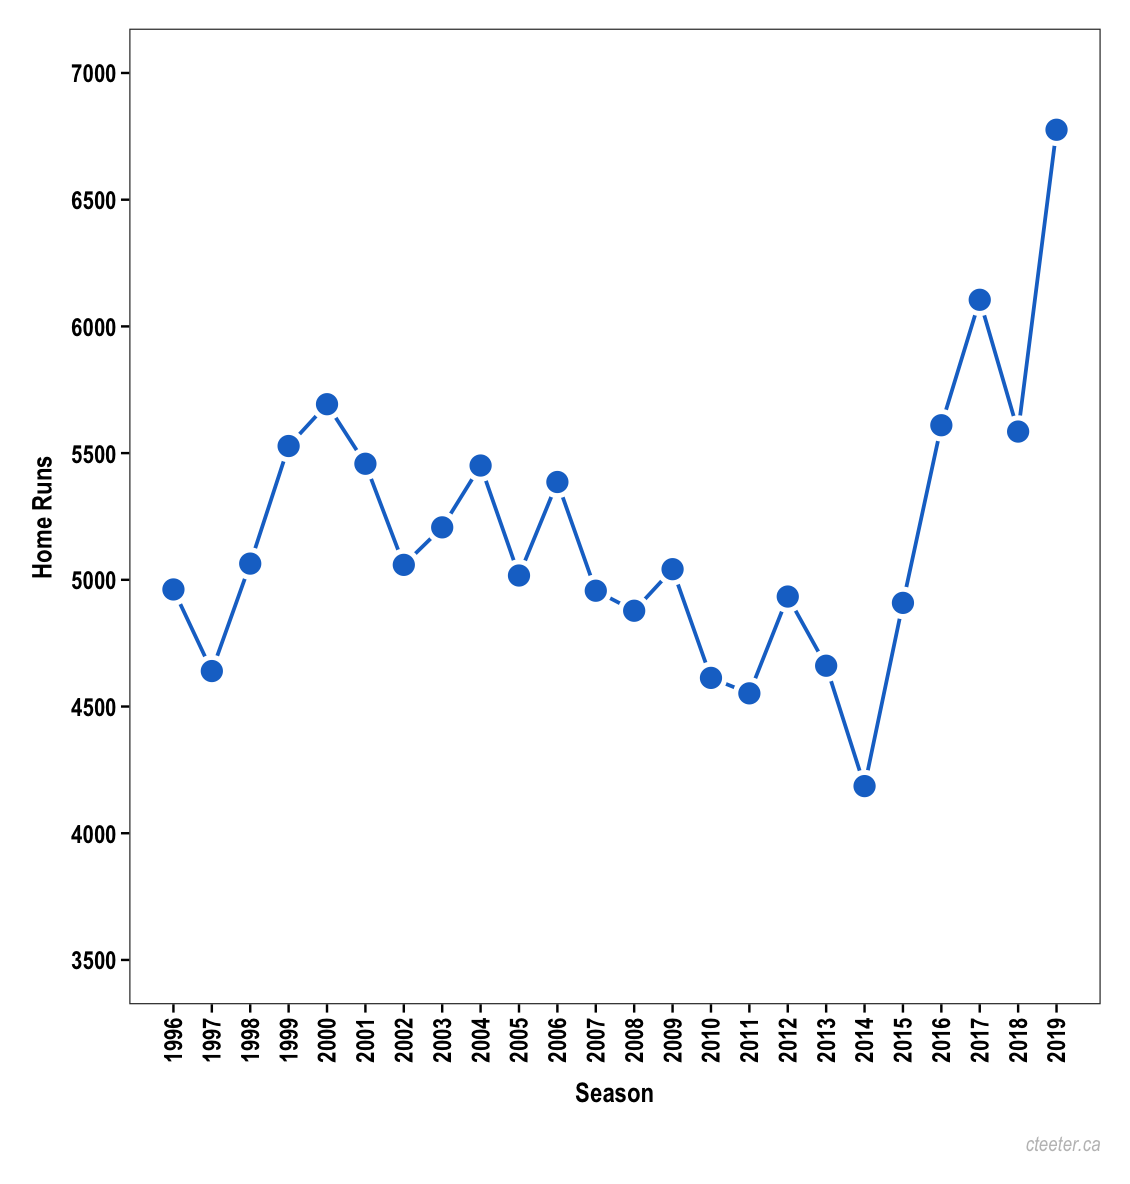
As far as we know, the primary driver of the leap in home runs we saw in 2019 is not a new undetectable super-steroid, but rather the ball, specifically its lower drag due to seam height, size, and leather smoothness. The manufacturing of the ball is changing the way it flies. Since June 2018, major league baseball has owned Rawlings, the manufacturer of the ball. One wonders if, in the face of year-over-year drops in attendance, the league made changes to the ball in order to increase the number of home runs and get more fans to games. Or did they just not realize how small changes in manufacturing can impact onfield play? For now, we can only speculate. Regardless of intention or incompetence, what is undeniable is that a change to the equipment, especially the most important piece of equipment, affects everyone; not just a band of rogue actors who choose to inject themselves with magic-home-run-hitting-juice.
We can see the widespread impact of better ball flight in the data (everything here comes from FanGraphs.com). First, let’s return to the number of 30-dingerers. In 2019, 18.1% of the players who made at least 250 plate appearances (PA) hit 30 or more home runs. That is the highest percentage on record since 1996:
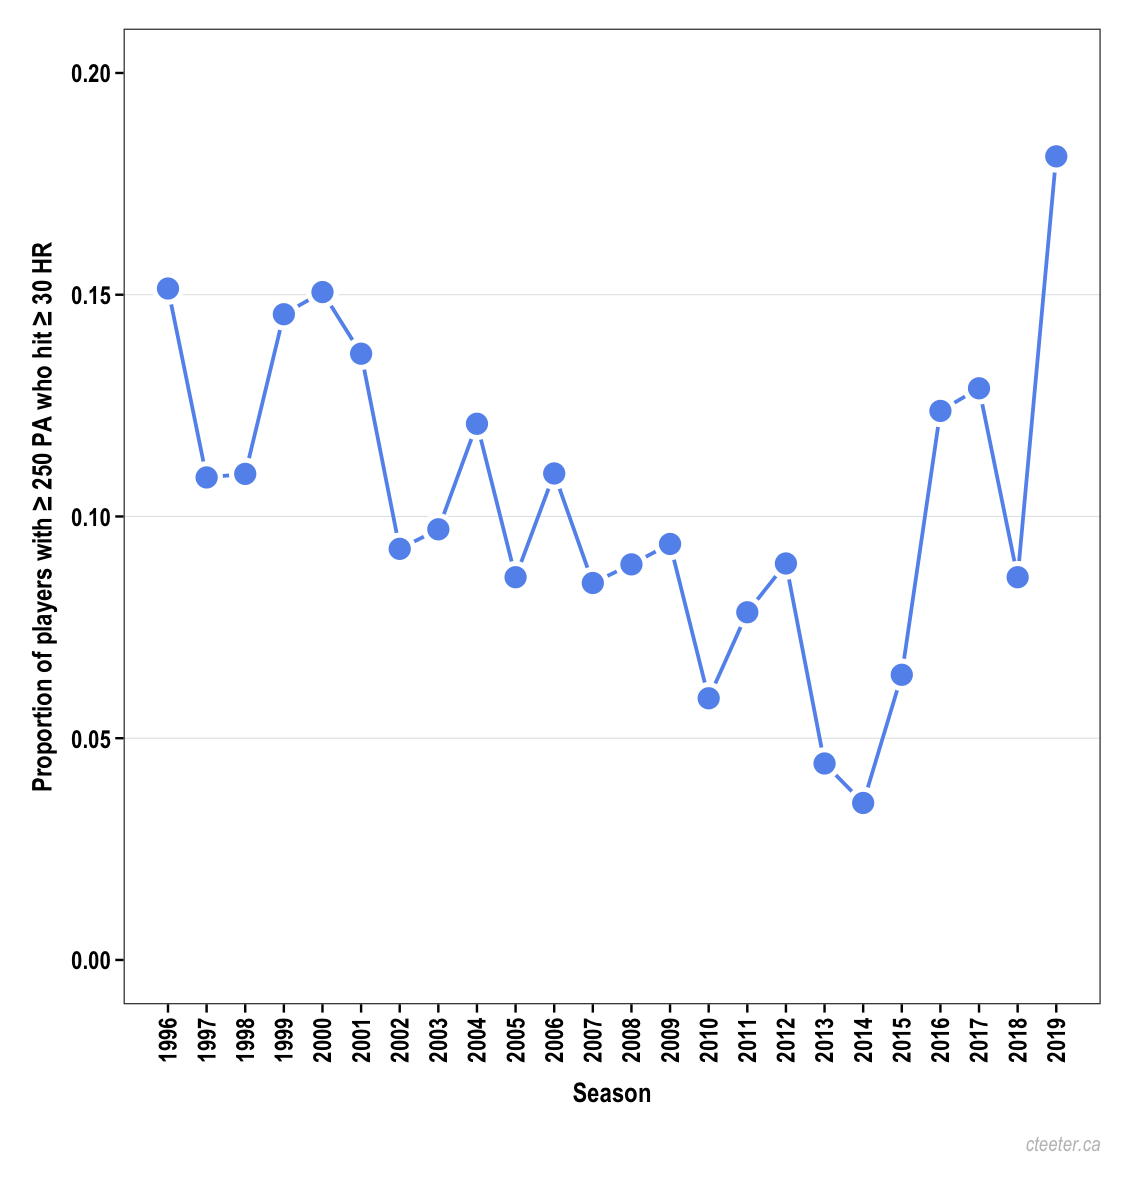
You can see the bumps in the steroid era (1998-2001), and in 2016-2017 (MLB commissioned a Home Run Committee to investigate the home run surges in these years), but even those ‘peaks’ fall at least three percentage points lower than what we saw in 2019.
Hitting 30 home runs is a remarkable achievement, but it also an arbitrary threshold to care about. The way the ball was flying last year didn’t just push a greater proportion of players over the 30 HR line, it helped a greater proportion of players hit more home runs in 2019 than they had in 2018. These year-over-year comparisons are revealing. Below is a plot of HR/PA difference scores between 2019 and 2018 for all players who made at least 250 PA in each season:
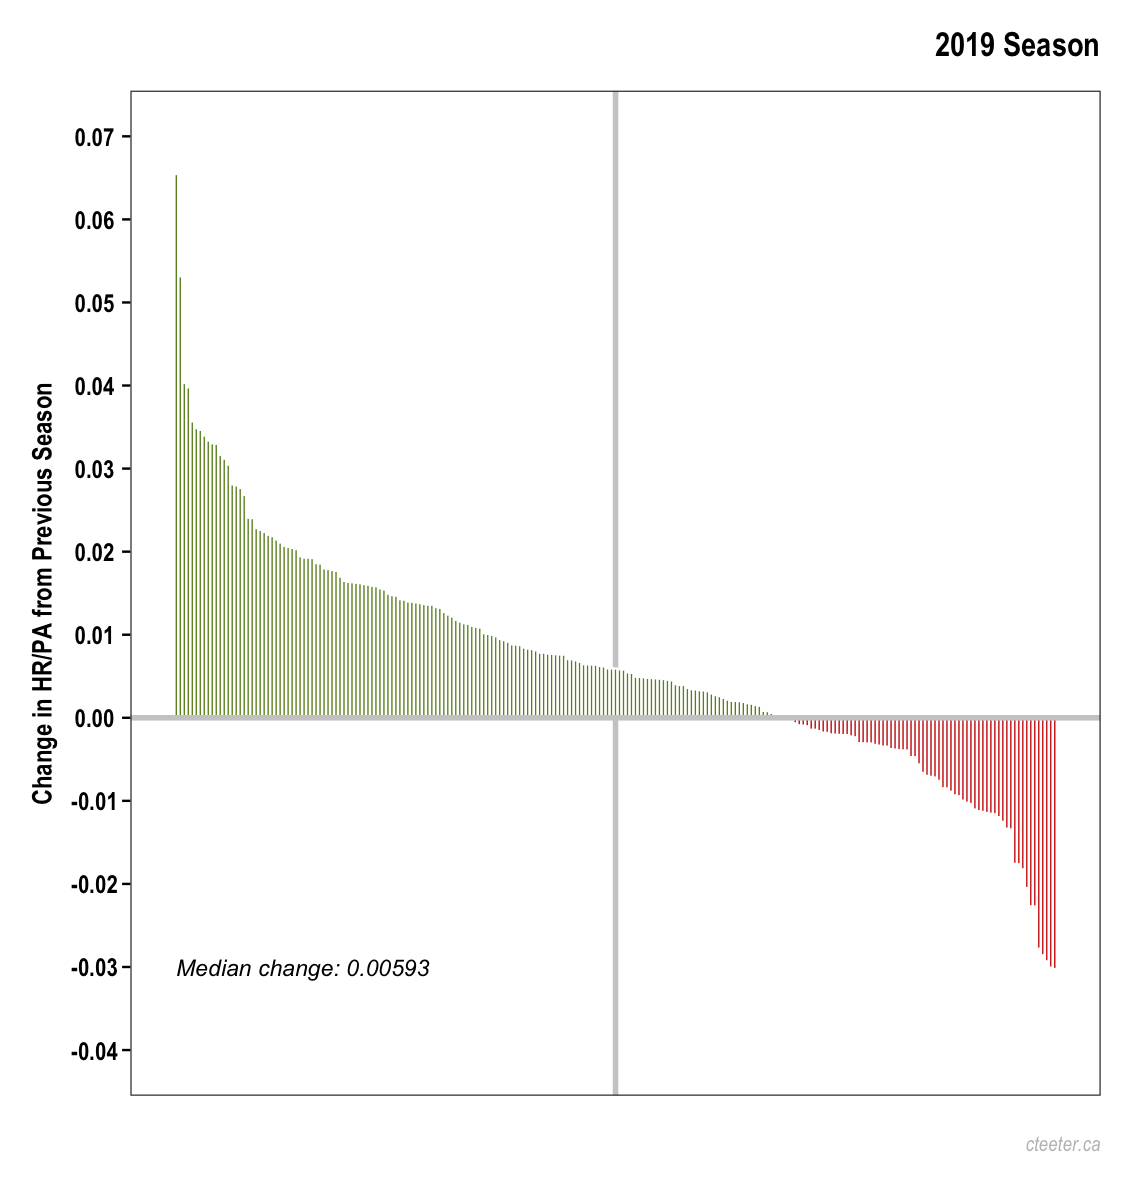
A reasonable expectation would be for about half of the players to be better in 2019 than in 2018 and about half of the players to be worse in 2019 than in 2018, with a median HR/PA change near zero. That is clearly not what happened. 68.8% had a higher HR/PA in 2019 than in 2018 with a median HR/PA change of nearly 0.6%. As a point of comparison, here is the analysis for the 2009 season, in which 48.1% had a higher HR/PA than in 2008 and a median HR/PA change of -0.006% (effectively zero):
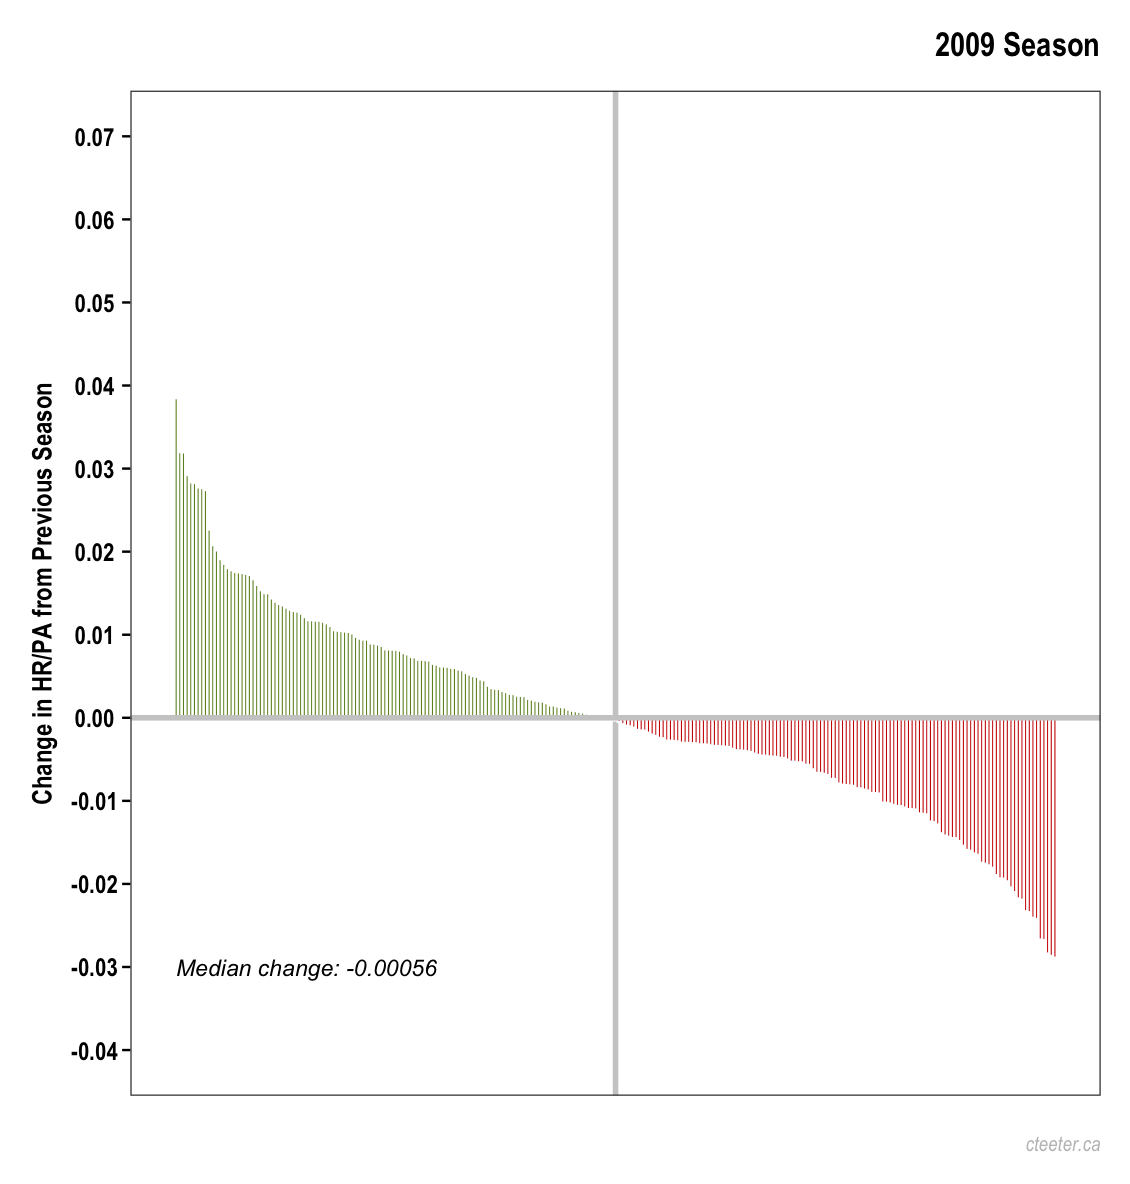
The 2009 season is the median season (for 1996 - 2019) in terms of proportion of players with a higher HR/PA in the season of interest relative to the previous season. You can see how different it is from 2019. It is not just the proportion of players who had a higher HR/PA and median change. In 2009, 12 players had a HR/PA change greater than or equal to 2% from 2008. In 2019, 31 players exceeded that change (from 2018). Among the risers, in 2009 the median increase was 0.8% and in 2019 it was 1.1%. That difference may not look like much, but it adds up. Over 400 PA it is an extra 1-2 home runs (per player). Overall, the 68.8% proportion of HR/PA risers observed in 2019 is the highest since 1996. The next highest is the 60.3% in 2016. Here is how it has trended since 1996 (the gray line marks the median):
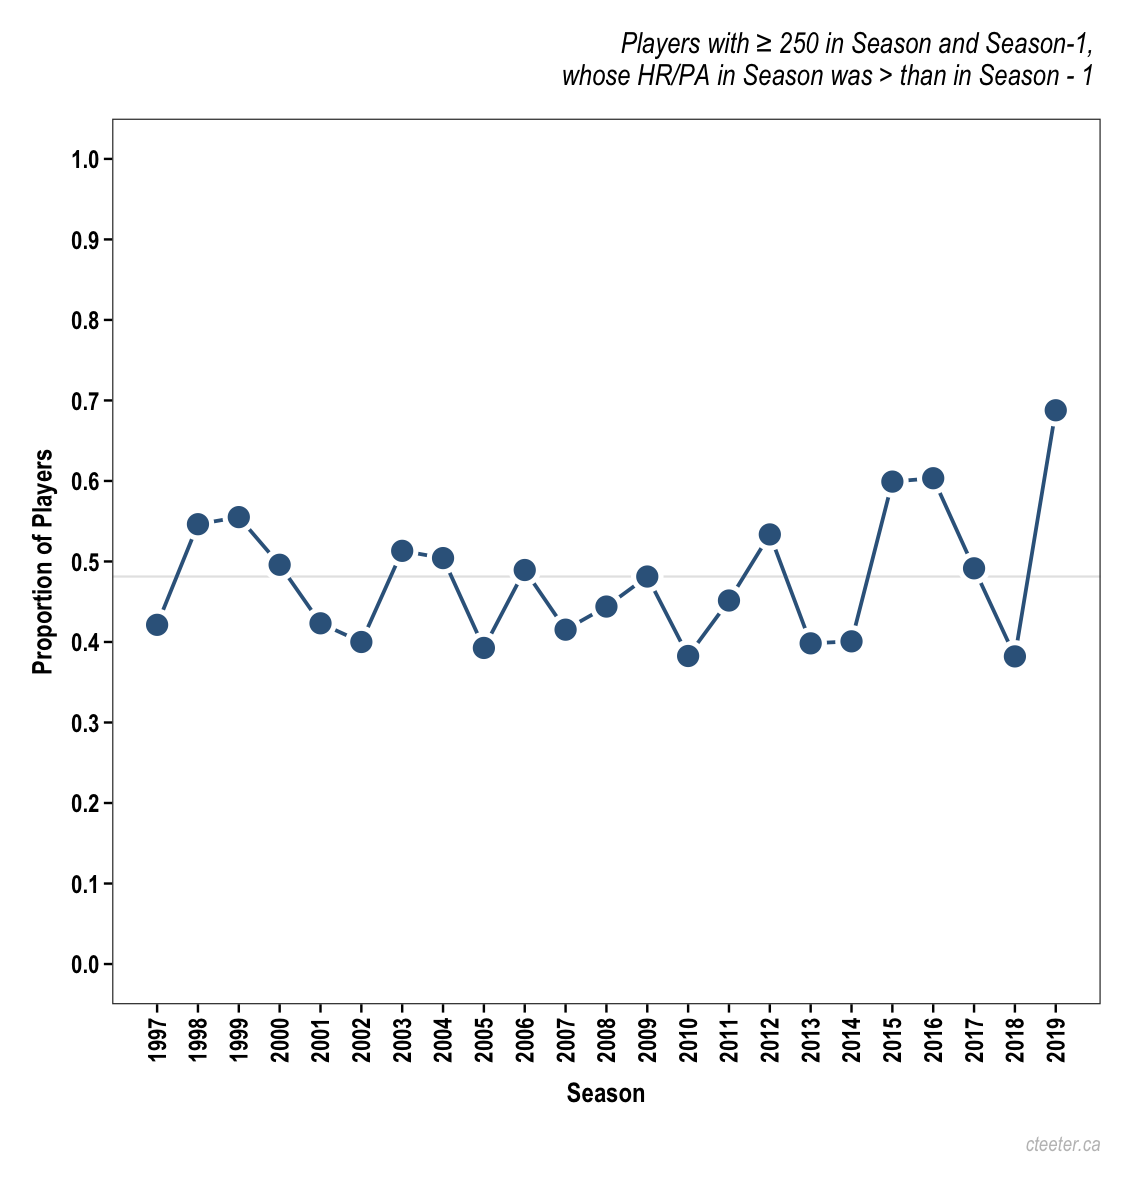
For the most part the proportion of year-over-year HR/PA performance risers has hovered around the 50% mark, which, as I noted above, is what you would expect. But recently we have seen big increases (2015 and 2016) and then the madness of 2019. Last year, the ball was flying and a lot of guys received a benefit. In addition to the ball, it could be that players learned to change their swings to launch the ball more and take advantage of the flight. It is easy to imagine how the rewards of doing so would push the behaviour and get others to try it out. Yet, at FiveThirtyEight, Rob Arthur showed that buying into the ‘fly-ball revolution’ in 2016 hurt as many players as it helped. I found a similar result for 2019 (minimum 250 PA):
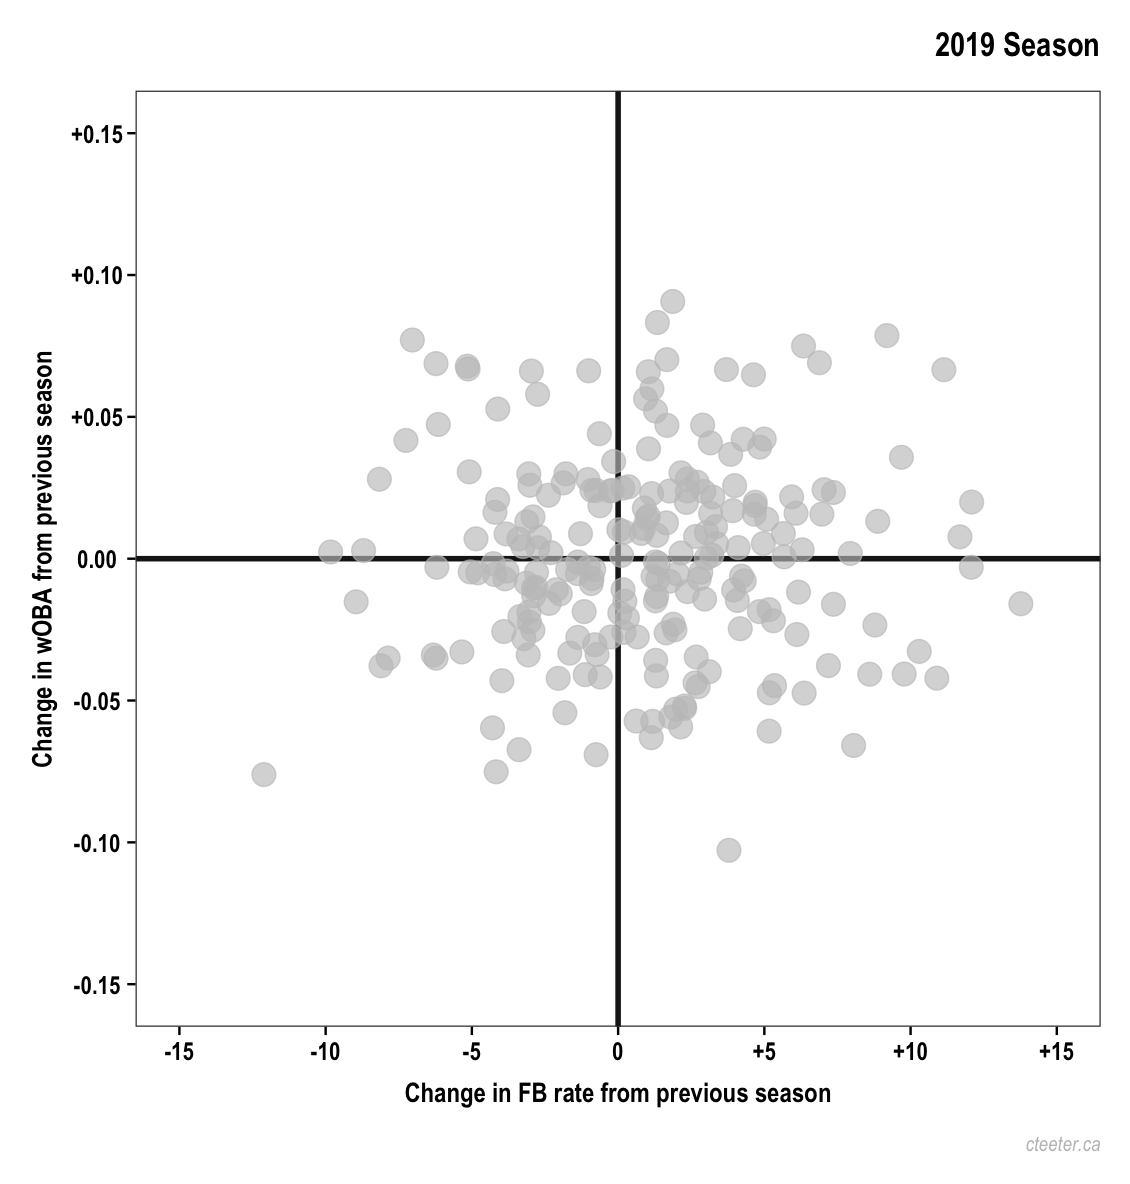
The first thing to note is that there was not a huge trend to higher fly-ball rates (FB%). 55% of the players included had higher FB% in 2019 than in 2018. This distribution at least partially undermines the idea that players en masse adopted swing changes to hit more fly balls. Among those those players who increased their fly-ball rate, there was a 54/46 split as to whether their weighted on-base average (wOBA) went up or down. There was no correlation between the change in fly ball rate and change in wOBA in 2019 (r = 0.03). But hitting a home run is just one component of wOBA. So while there were more home runs, there were likely more negative elements like strikeouts, fly outs and pop outs, and fewer of the other positive elements like doubles and triples. Thus, the lack of change in wOBA despite the change in HR/PA. The ball flying better will not turn any old fly-ball into a home run. Only some of the fly-balls that would be a double/triple/flyout in previous years would be a home run in 2019. With all that said, among those who increased their fly-ball rate, there was a 77/23 split as to whether their HR/PA went up or down (r = 0.36):
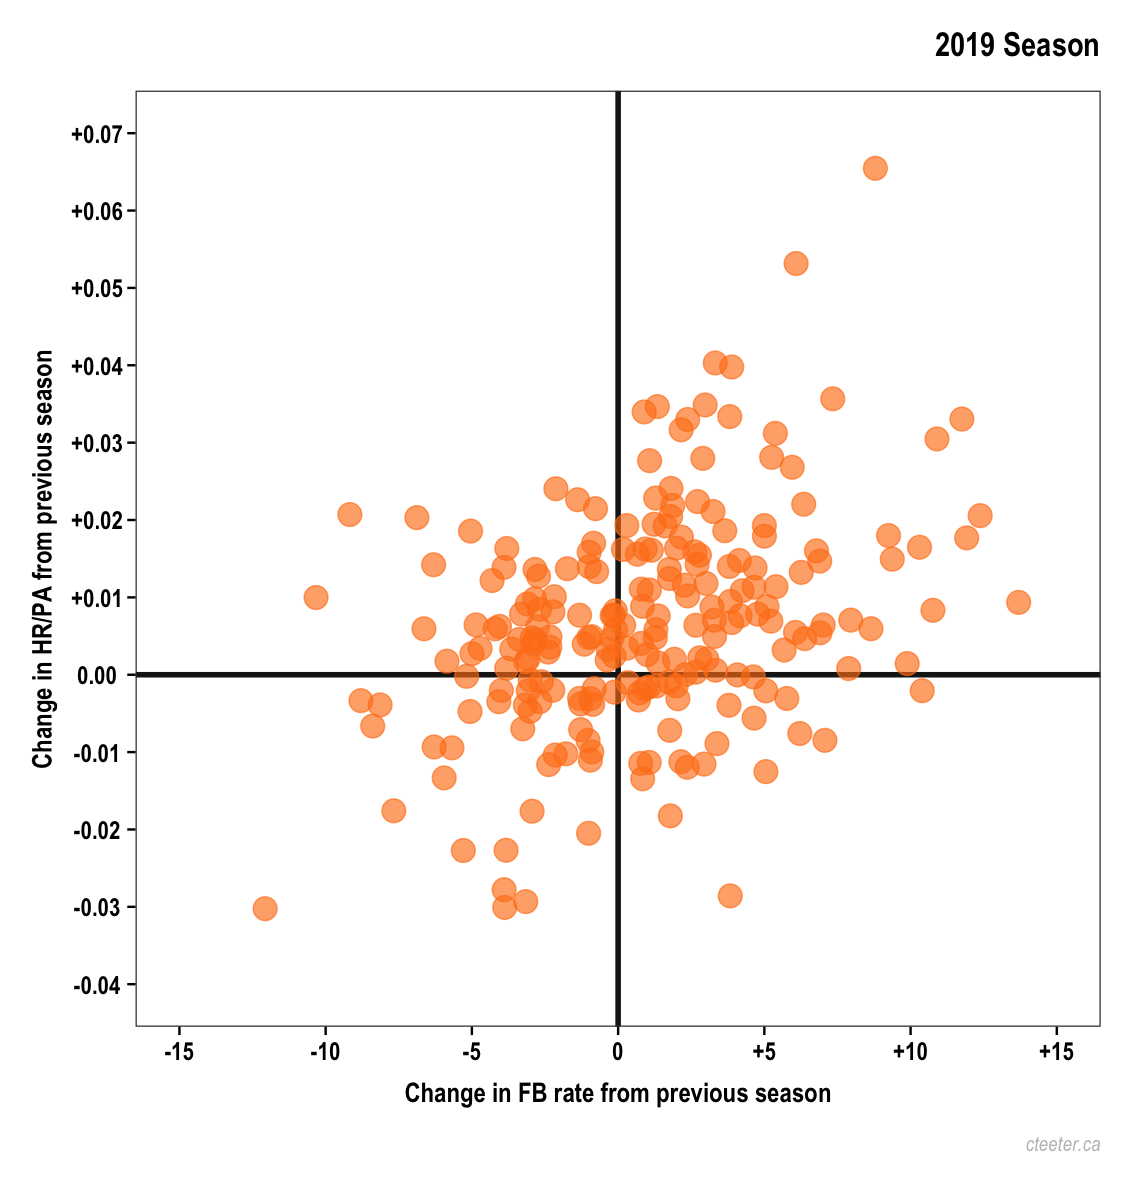
You have to hit the ball in the air to hit a home run. But hitting the ball in the air (and hitting more home runs) doesn’t necessarily make one a more overall productive hitter.
All in all, 2019 will be remembered as the year-of-the-home-run (or the start of the ‘Home-Run-Era’). An issue that arises is that, because the ball appears to have driven so much of the home run increase (and the change in player strategy), we don’t know what is real and therefore what to expect next year. What if the league changes the ball back to a deader ball (if they can). How quickly will hitters adapt? Will attendance/interest issues get worse if the game returns to a dead-ball era? And if the league can change the ball, how do we account for what happened in 2019? Was it truly just a change in manufacturing process? Or was it a directed effort to keep/get more eyes on the game? Further, if it was manufacturing, how much of the steroids era was actually due to a change in the ball? I have always found the take drugs, hit homers narrative to be overly simplistic. Regardless, the league needs to get a handle on this situation with its equipment. Improving the year-to-year consistency, that has been absent the last five years, is critical.